Immigrants from Lebanon vs Immigrants from Hong Kong Median Household Income
COMPARE
Immigrants from Lebanon
Immigrants from Hong Kong
Median Household Income
Median Household Income Comparison
Immigrants from Lebanon
Immigrants from Hong Kong
$91,887
MEDIAN HOUSEHOLD INCOME
98.7/ 100
METRIC RATING
93rd/ 347
METRIC RANK
$111,519
MEDIAN HOUSEHOLD INCOME
100.0/ 100
METRIC RATING
4th/ 347
METRIC RANK
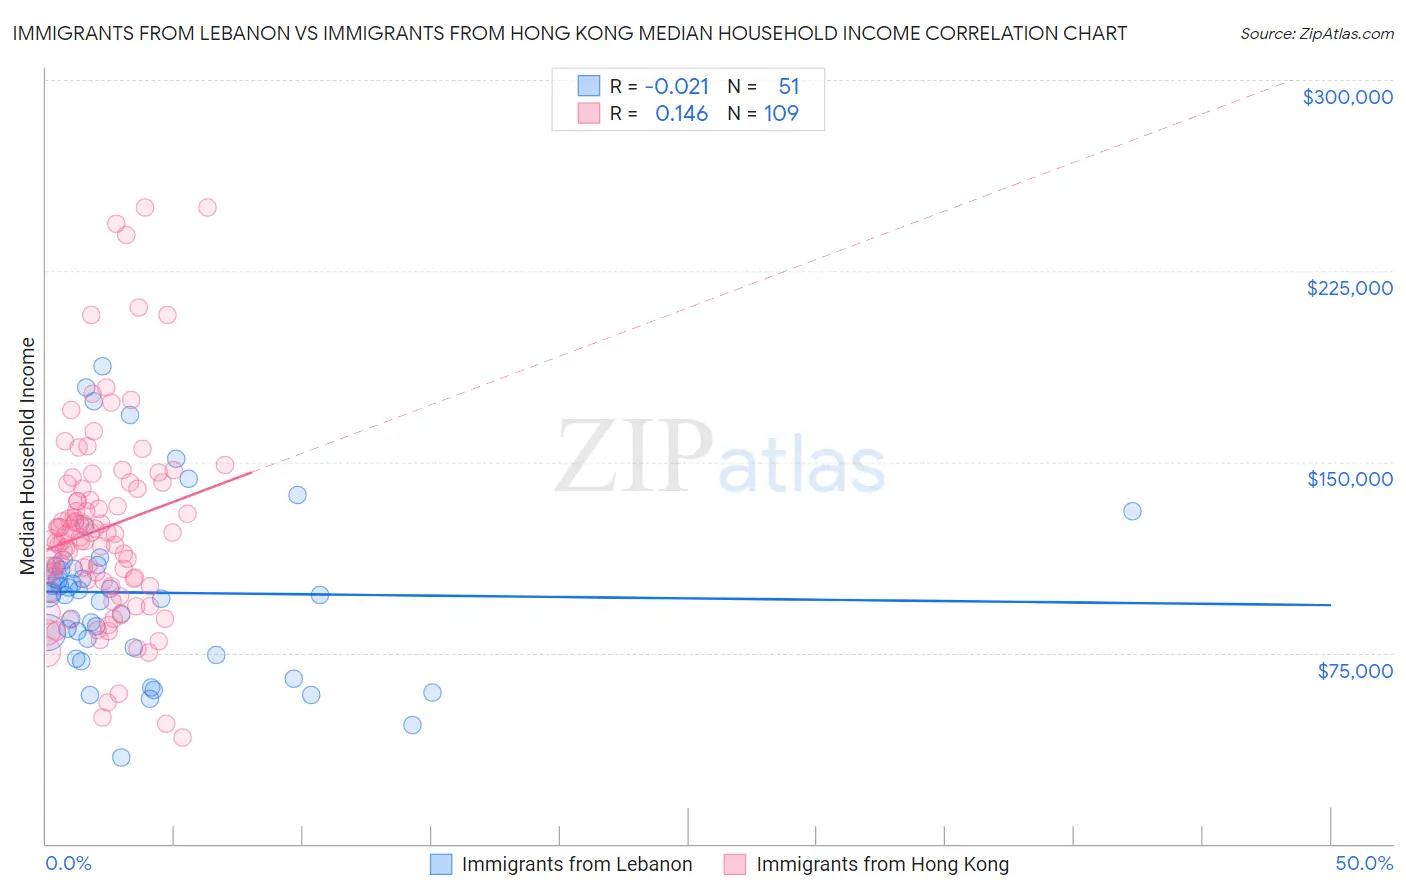
Immigrants from Lebanon vs Immigrants from Hong Kong Median Household Income Correlation Chart
The statistical analysis conducted on geographies consisting of 217,104,456 people shows no correlation between the proportion of Immigrants from Lebanon and median household income in the United States with a correlation coefficient (R) of -0.021 and weighted average of $91,887. Similarly, the statistical analysis conducted on geographies consisting of 253,858,060 people shows a poor positive correlation between the proportion of Immigrants from Hong Kong and median household income in the United States with a correlation coefficient (R) of 0.146 and weighted average of $111,519, a difference of 21.4%.
Median Household Income Correlation Summary
| Measurement | Immigrants from Lebanon | Immigrants from Hong Kong |
| Minimum | $33,750 | $41,563 |
| Maximum | $187,750 | $250,001 |
| Range | $154,000 | $208,438 |
| Mean | $98,672 | $123,651 |
| Median | $97,787 | $120,226 |
| Interquartile 25% (IQ1) | $76,889 | $102,101 |
| Interquartile 75% (IQ3) | $108,907 | $139,539 |
| Interquartile Range (IQR) | $32,018 | $37,437 |
| Standard Deviation (Sample) | $33,219 | $39,253 |
| Standard Deviation (Population) | $32,891 | $39,072 |
Similar Demographics by Median Household Income
Demographics Similar to Immigrants from Lebanon by Median Household Income
In terms of median household income, the demographic groups most similar to Immigrants from Lebanon are Immigrants from North America ($91,860, a difference of 0.030%), Immigrants from Western Europe ($91,936, a difference of 0.050%), Armenian ($91,807, a difference of 0.090%), Jordanian ($91,794, a difference of 0.10%), and Assyrian/Chaldean/Syriac ($91,991, a difference of 0.11%).
| Demographics | Rating | Rank | Median Household Income |
| Immigrants | England | 98.9 /100 | #86 | Exceptional $92,098 |
| Immigrants | Hungary | 98.9 /100 | #87 | Exceptional $92,094 |
| Immigrants | Canada | 98.8 /100 | #88 | Exceptional $92,029 |
| Romanians | 98.8 /100 | #89 | Exceptional $91,994 |
| Assyrians/Chaldeans/Syriacs | 98.8 /100 | #90 | Exceptional $91,991 |
| Immigrants | Vietnam | 98.8 /100 | #91 | Exceptional $91,987 |
| Immigrants | Western Europe | 98.8 /100 | #92 | Exceptional $91,936 |
| Immigrants | Lebanon | 98.7 /100 | #93 | Exceptional $91,887 |
| Immigrants | North America | 98.7 /100 | #94 | Exceptional $91,860 |
| Armenians | 98.7 /100 | #95 | Exceptional $91,807 |
| Jordanians | 98.7 /100 | #96 | Exceptional $91,794 |
| Immigrants | Serbia | 98.6 /100 | #97 | Exceptional $91,730 |
| Immigrants | Southern Europe | 98.5 /100 | #98 | Exceptional $91,605 |
| Immigrants | South Eastern Asia | 98.4 /100 | #99 | Exceptional $91,541 |
| Ukrainians | 98.3 /100 | #100 | Exceptional $91,456 |
Demographics Similar to Immigrants from Hong Kong by Median Household Income
In terms of median household income, the demographic groups most similar to Immigrants from Hong Kong are Thai ($110,648, a difference of 0.79%), Immigrants from Singapore ($110,428, a difference of 0.99%), Immigrants from India ($113,009, a difference of 1.3%), Iranian ($109,835, a difference of 1.5%), and Immigrants from Iran ($108,055, a difference of 3.2%).
| Demographics | Rating | Rank | Median Household Income |
| Immigrants | Taiwan | 100.0 /100 | #1 | Exceptional $116,460 |
| Filipinos | 100.0 /100 | #2 | Exceptional $115,509 |
| Immigrants | India | 100.0 /100 | #3 | Exceptional $113,009 |
| Immigrants | Hong Kong | 100.0 /100 | #4 | Exceptional $111,519 |
| Thais | 100.0 /100 | #5 | Exceptional $110,648 |
| Immigrants | Singapore | 100.0 /100 | #6 | Exceptional $110,428 |
| Iranians | 100.0 /100 | #7 | Exceptional $109,835 |
| Immigrants | Iran | 100.0 /100 | #8 | Exceptional $108,055 |
| Okinawans | 100.0 /100 | #9 | Exceptional $106,624 |
| Immigrants | South Central Asia | 100.0 /100 | #10 | Exceptional $106,057 |
| Immigrants | China | 100.0 /100 | #11 | Exceptional $105,335 |
| Indians (Asian) | 100.0 /100 | #12 | Exceptional $105,262 |
| Immigrants | Eastern Asia | 100.0 /100 | #13 | Exceptional $104,796 |
| Immigrants | Ireland | 100.0 /100 | #14 | Exceptional $104,692 |
| Immigrants | Israel | 100.0 /100 | #15 | Exceptional $104,090 |