African vs German Russian Median Household Income
COMPARE
African
German Russian
Median Household Income
Median Household Income Comparison
Africans
German Russians
$72,650
MEDIAN HOUSEHOLD INCOME
0.0/ 100
METRIC RATING
303rd/ 347
METRIC RANK
$75,856
MEDIAN HOUSEHOLD INCOME
0.3/ 100
METRIC RATING
267th/ 347
METRIC RANK
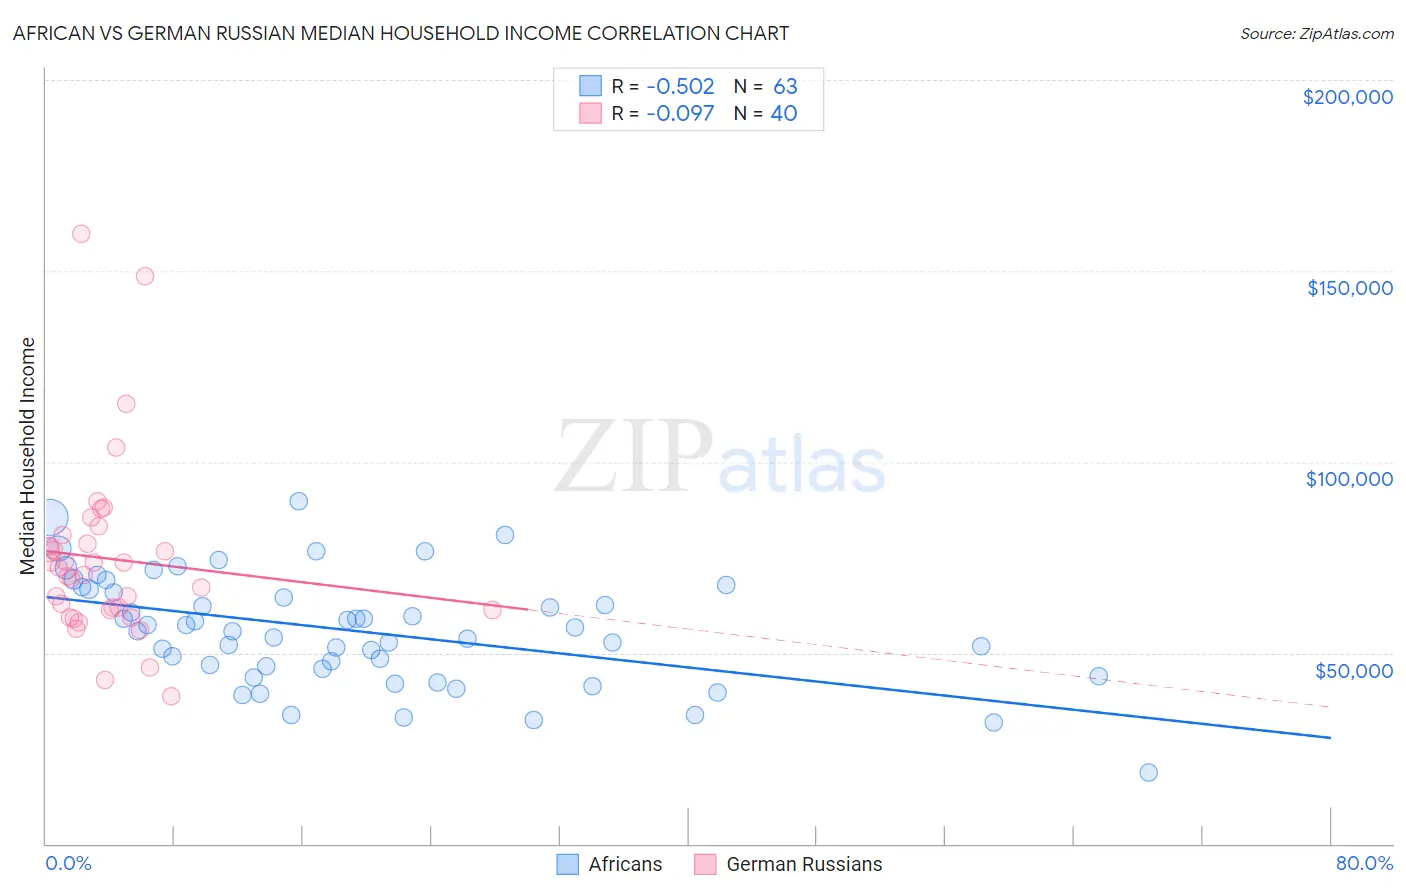
African vs German Russian Median Household Income Correlation Chart
The statistical analysis conducted on geographies consisting of 469,417,783 people shows a substantial negative correlation between the proportion of Africans and median household income in the United States with a correlation coefficient (R) of -0.502 and weighted average of $72,650. Similarly, the statistical analysis conducted on geographies consisting of 96,440,966 people shows a slight negative correlation between the proportion of German Russians and median household income in the United States with a correlation coefficient (R) of -0.097 and weighted average of $75,856, a difference of 4.4%.
Median Household Income Correlation Summary
| Measurement | African | German Russian |
| Minimum | $18,750 | $38,750 |
| Maximum | $89,652 | $159,827 |
| Range | $70,902 | $121,077 |
| Mean | $55,711 | $74,697 |
| Median | $55,621 | $71,396 |
| Interquartile 25% (IQ1) | $45,960 | $61,250 |
| Interquartile 75% (IQ3) | $66,633 | $79,678 |
| Interquartile Range (IQR) | $20,673 | $18,428 |
| Standard Deviation (Sample) | $14,453 | $23,757 |
| Standard Deviation (Population) | $14,338 | $23,458 |
Similar Demographics by Median Household Income
Demographics Similar to Africans by Median Household Income
In terms of median household income, the demographic groups most similar to Africans are Shoshone ($72,660, a difference of 0.010%), Cherokee ($72,682, a difference of 0.040%), Immigrants from Haiti ($72,599, a difference of 0.070%), Honduran ($72,588, a difference of 0.090%), and Potawatomi ($72,576, a difference of 0.10%).
| Demographics | Rating | Rank | Median Household Income |
| Haitians | 0.1 /100 | #296 | Tragic $73,306 |
| Immigrants | Mexico | 0.0 /100 | #297 | Tragic $73,160 |
| Paiute | 0.0 /100 | #298 | Tragic $72,959 |
| Indonesians | 0.0 /100 | #299 | Tragic $72,856 |
| Immigrants | Dominica | 0.0 /100 | #300 | Tragic $72,760 |
| Cherokee | 0.0 /100 | #301 | Tragic $72,682 |
| Shoshone | 0.0 /100 | #302 | Tragic $72,660 |
| Africans | 0.0 /100 | #303 | Tragic $72,650 |
| Immigrants | Haiti | 0.0 /100 | #304 | Tragic $72,599 |
| Hondurans | 0.0 /100 | #305 | Tragic $72,588 |
| Potawatomi | 0.0 /100 | #306 | Tragic $72,576 |
| Ute | 0.0 /100 | #307 | Tragic $72,402 |
| Yakama | 0.0 /100 | #308 | Tragic $72,225 |
| Immigrants | Caribbean | 0.0 /100 | #309 | Tragic $71,860 |
| U.S. Virgin Islanders | 0.0 /100 | #310 | Tragic $71,853 |
Demographics Similar to German Russians by Median Household Income
In terms of median household income, the demographic groups most similar to German Russians are Immigrants from Jamaica ($75,851, a difference of 0.010%), Cape Verdean ($75,848, a difference of 0.010%), Hmong ($75,839, a difference of 0.020%), Pennsylvania German ($75,814, a difference of 0.060%), and American ($75,932, a difference of 0.10%).
| Demographics | Rating | Rank | Median Household Income |
| Jamaicans | 0.4 /100 | #260 | Tragic $76,583 |
| Immigrants | Grenada | 0.4 /100 | #261 | Tragic $76,517 |
| French American Indians | 0.4 /100 | #262 | Tragic $76,387 |
| Alaskan Athabascans | 0.4 /100 | #263 | Tragic $76,383 |
| Guatemalans | 0.3 /100 | #264 | Tragic $75,961 |
| Immigrants | Belize | 0.3 /100 | #265 | Tragic $75,938 |
| Americans | 0.3 /100 | #266 | Tragic $75,932 |
| German Russians | 0.3 /100 | #267 | Tragic $75,856 |
| Immigrants | Jamaica | 0.3 /100 | #268 | Tragic $75,851 |
| Cape Verdeans | 0.3 /100 | #269 | Tragic $75,848 |
| Hmong | 0.3 /100 | #270 | Tragic $75,839 |
| Pennsylvania Germans | 0.3 /100 | #271 | Tragic $75,814 |
| Somalis | 0.3 /100 | #272 | Tragic $75,782 |
| Liberians | 0.2 /100 | #273 | Tragic $75,667 |
| British West Indians | 0.2 /100 | #274 | Tragic $75,647 |