Zip Codes with the Highest Percentage of Population Taking Taxi / Cab to Work in Mishawaka, IN
RELATED REPORTS & OPTIONS
Taxi / Cab
Mishawaka
Compare Zip Codes
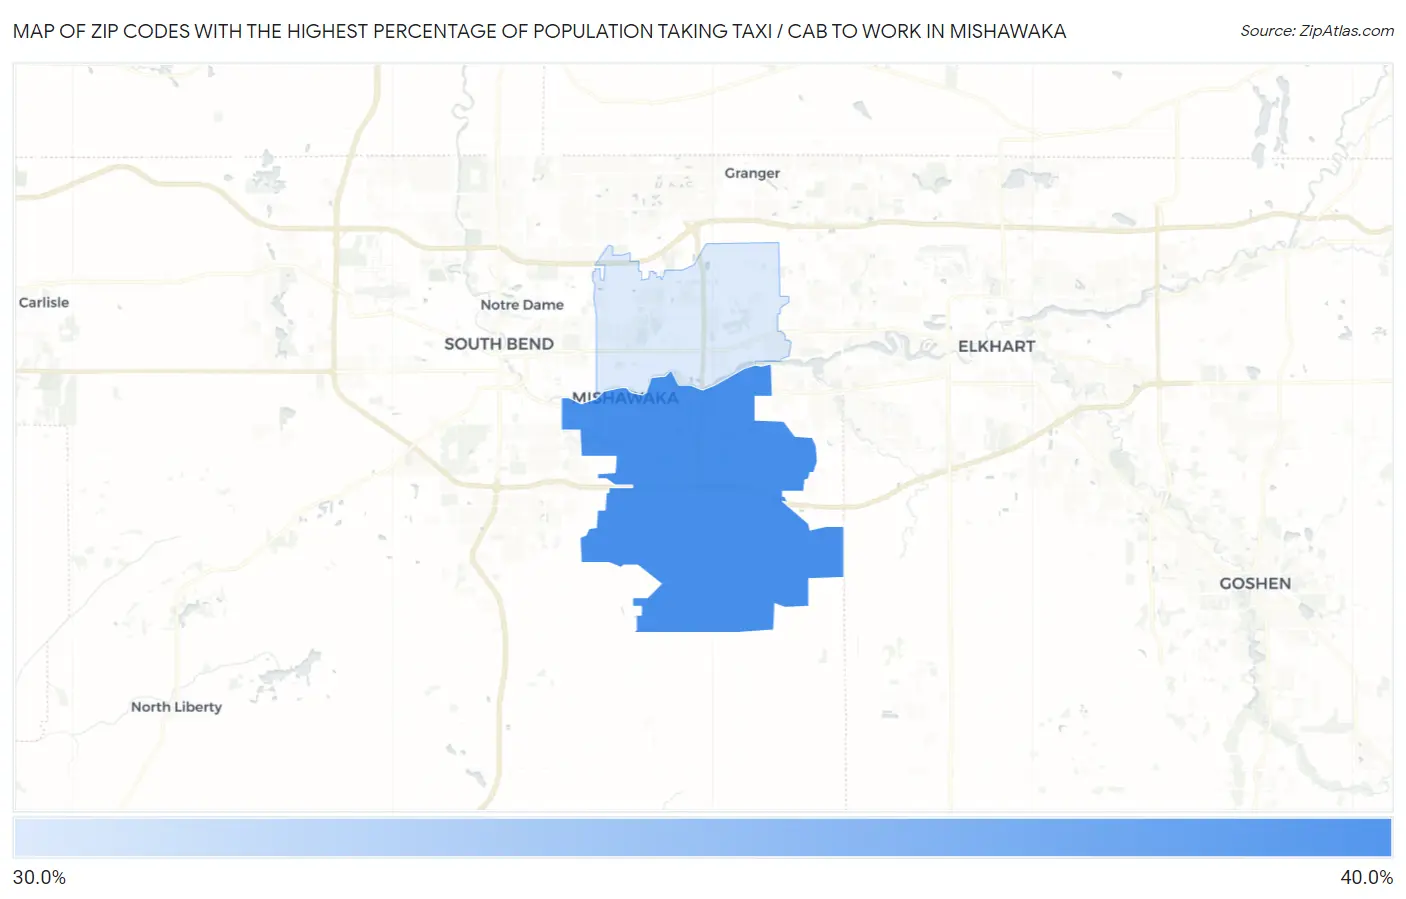
Map of Zip Codes with the Highest Percentage of Population Taking Taxi / Cab to Work in Mishawaka
37.0%
39.9%
Zip Codes with the Highest Percentage of Population Taking Taxi / Cab to Work in Mishawaka, IN
| Zip Code | % Take Taxi / Cab | vs State | vs National | |
| 1. | 46544 | 39.9% | 37.0%(+2.90)#141 | 38.2%(+1.70)#6,657 |
| 2. | 46545 | 37.0% | 37.0%(=0.000)#161 | 38.2%(-1.20)#7,948 |
1
Common Questions
What are the Top Zip Codes with the Highest Percentage of Population Taking Taxi / Cab to Work in Mishawaka, IN?
Top Zip Codes with the Highest Percentage of Population Taking Taxi / Cab to Work in Mishawaka, IN are:
What zip code has the Highest Percentage of Population Taking Taxi / Cab to Work in Mishawaka, IN?
46544 has the Highest Percentage of Population Taking Taxi / Cab to Work in Mishawaka, IN with 39.9%.
What is the Percentage of Population Taking Taxi / Cab to Work in Mishawaka, IN?
Percentage of Population Taking Taxi / Cab to Work in Mishawaka is 36.8%.
What is the Percentage of Population Taking Taxi / Cab to Work in Indiana?
Percentage of Population Taking Taxi / Cab to Work in Indiana is 37.0%.
What is the Percentage of Population Taking Taxi / Cab to Work in the United States?
Percentage of Population Taking Taxi / Cab to Work in the United States is 38.2%.