Zip Codes with the Highest Percentage of Population Employed in Legal Services & Support in Saint Charles, IL
RELATED REPORTS & OPTIONS
Legal Services & Support
Saint Charles
Compare Zip Codes
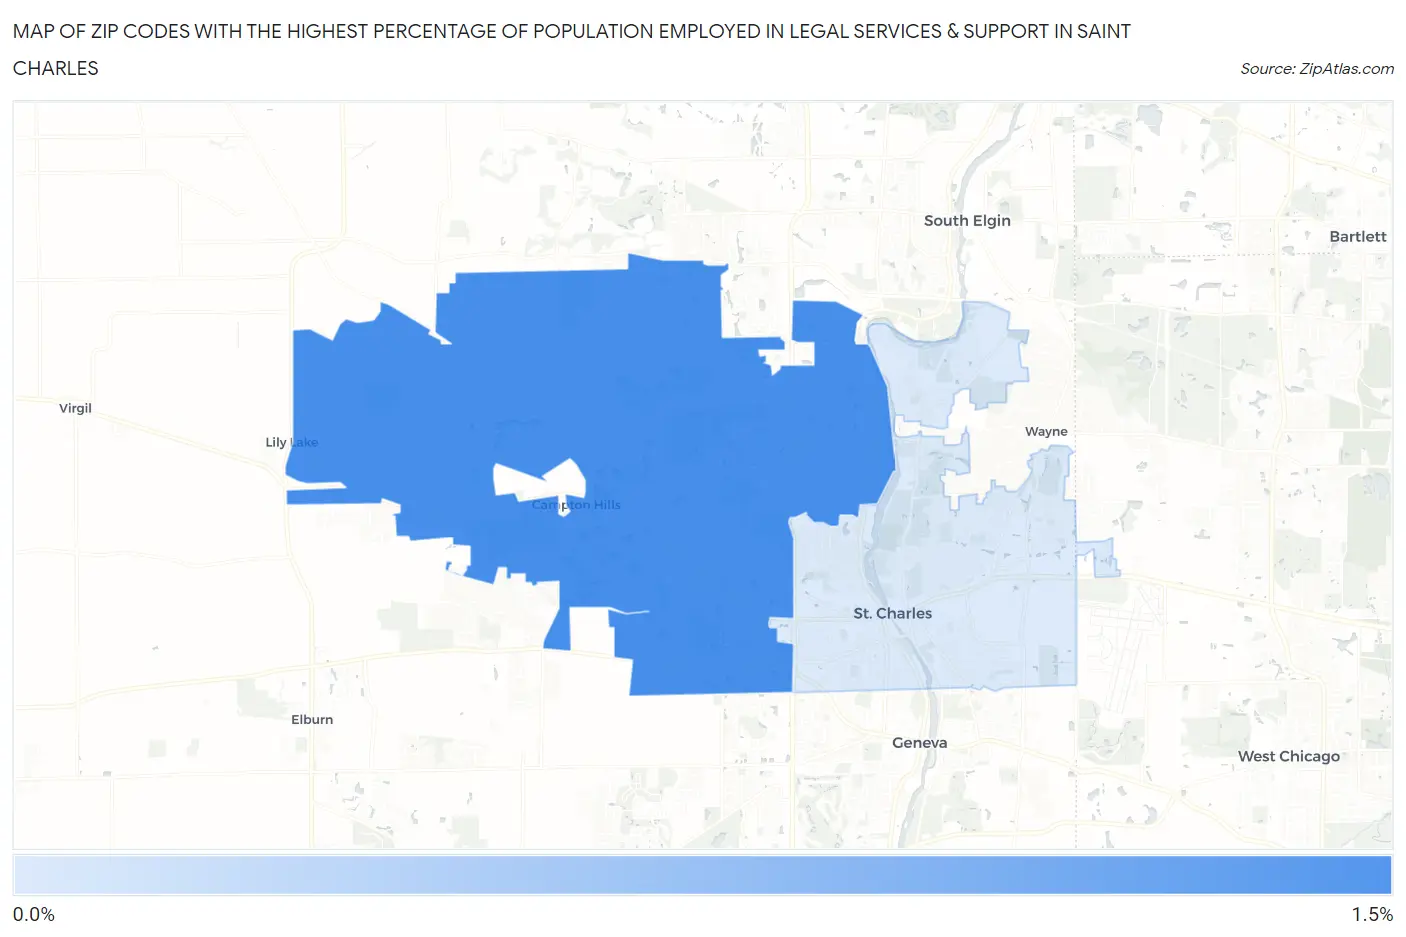
Map of Zip Codes with the Highest Percentage of Population Employed in Legal Services & Support in Saint Charles
0.35%
1.5%
Zip Codes with the Highest Percentage of Population Employed in Legal Services & Support in Saint Charles, IL
| Zip Code | % Employed | vs State | vs National | |
| 1. | 60175 | 1.5% | 1.3%(+0.104)#195 | 1.2%(+0.270)#5,245 |
| 2. | 60174 | 0.35% | 1.3%(-0.999)#581 | 1.2%(-0.834)#14,460 |
1
Common Questions
What are the Top Zip Codes with the Highest Percentage of Population Employed in Legal Services & Support in Saint Charles, IL?
Top Zip Codes with the Highest Percentage of Population Employed in Legal Services & Support in Saint Charles, IL are:
What zip code has the Highest Percentage of Population Employed in Legal Services & Support in Saint Charles, IL?
60175 has the Highest Percentage of Population Employed in Legal Services & Support in Saint Charles, IL with 1.5%.
What is the Percentage of Population Employed in Legal Services & Support in Illinois?
Percentage of Population Employed in Legal Services & Support in Illinois is 1.3%.
What is the Percentage of Population Employed in Legal Services & Support in the United States?
Percentage of Population Employed in Legal Services & Support in the United States is 1.2%.