Zip Codes with the Highest Percentage of Population Employed in Legal Services & Support in Deland, FL
RELATED REPORTS & OPTIONS
Legal Services & Support
Deland
Compare Zip Codes
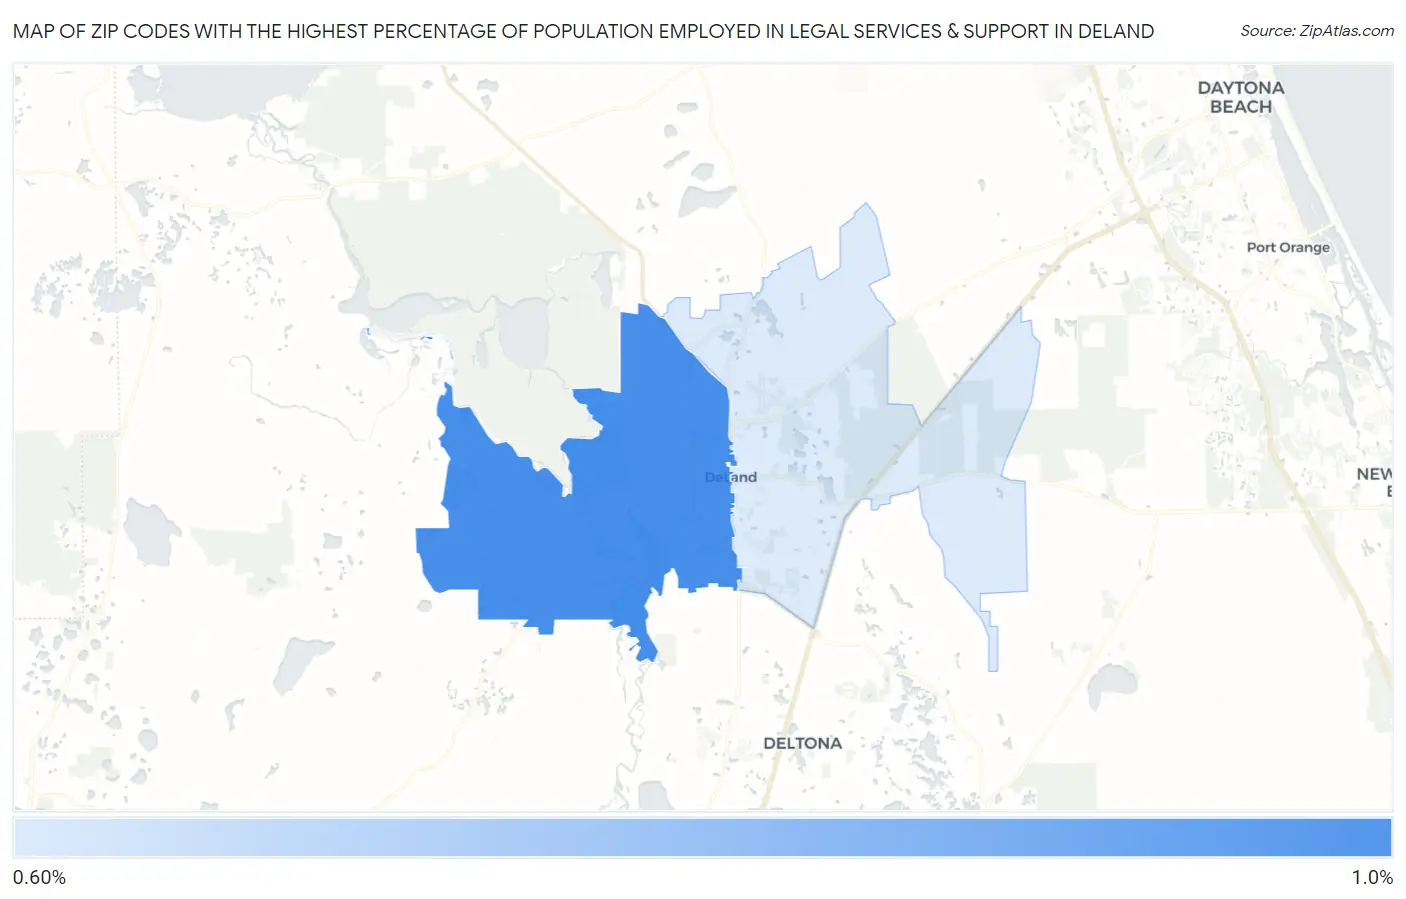
Map of Zip Codes with the Highest Percentage of Population Employed in Legal Services & Support in Deland
0.66%
0.92%
Zip Codes with the Highest Percentage of Population Employed in Legal Services & Support in Deland, FL
| Zip Code | % Employed | vs State | vs National | |
| 1. | 32720 | 0.92% | 1.3%(-0.397)#449 | 1.2%(-0.264)#8,432 |
| 2. | 32724 | 0.66% | 1.3%(-0.652)#560 | 1.2%(-0.519)#10,787 |
1
Common Questions
What are the Top Zip Codes with the Highest Percentage of Population Employed in Legal Services & Support in Deland, FL?
Top Zip Codes with the Highest Percentage of Population Employed in Legal Services & Support in Deland, FL are:
What zip code has the Highest Percentage of Population Employed in Legal Services & Support in Deland, FL?
32720 has the Highest Percentage of Population Employed in Legal Services & Support in Deland, FL with 0.92%.
What is the Percentage of Population Employed in Legal Services & Support in Deland, FL?
Percentage of Population Employed in Legal Services & Support in Deland is 0.53%.
What is the Percentage of Population Employed in Legal Services & Support in Florida?
Percentage of Population Employed in Legal Services & Support in Florida is 1.3%.
What is the Percentage of Population Employed in Legal Services & Support in the United States?
Percentage of Population Employed in Legal Services & Support in the United States is 1.2%.