Zip Codes with the Highest Percentage of Population Employed in Farming, Fishing & Forestry in Deland, FL
RELATED REPORTS & OPTIONS
Farming, Fishing & Forestry
Deland
Compare Zip Codes
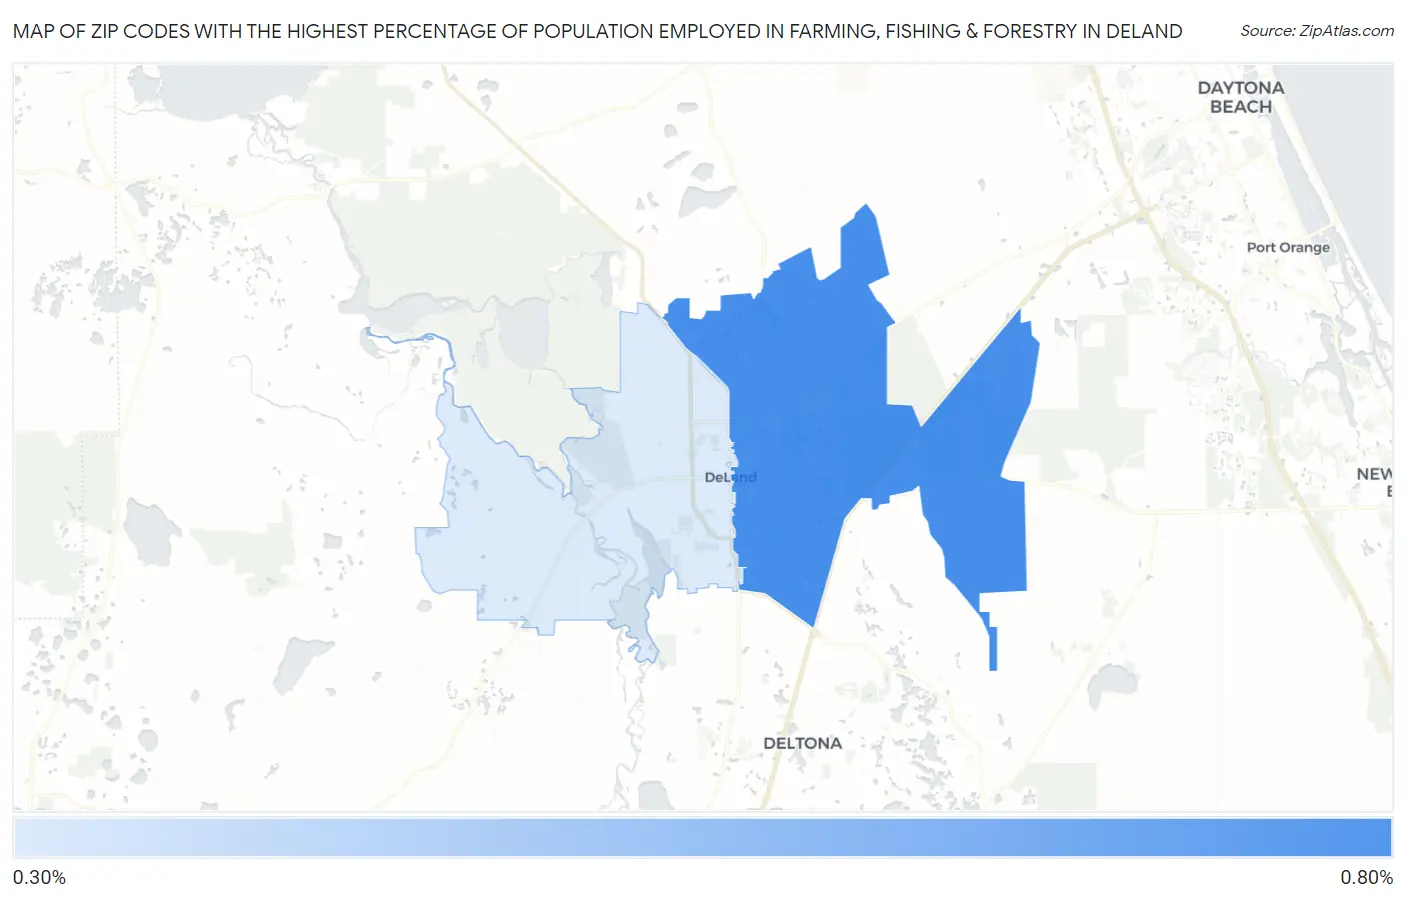
Map of Zip Codes with the Highest Percentage of Population Employed in Farming, Fishing & Forestry in Deland
0.33%
0.61%
Zip Codes with the Highest Percentage of Population Employed in Farming, Fishing & Forestry in Deland, FL
| Zip Code | % Employed | vs State | vs National | |
| 1. | 32724 | 0.61% | 0.47%(+0.144)#253 | 0.61%(+0.008)#11,935 |
| 2. | 32720 | 0.33% | 0.47%(-0.135)#364 | 0.61%(-0.272)#14,450 |
1
Common Questions
What are the Top Zip Codes with the Highest Percentage of Population Employed in Farming, Fishing & Forestry in Deland, FL?
Top Zip Codes with the Highest Percentage of Population Employed in Farming, Fishing & Forestry in Deland, FL are:
What zip code has the Highest Percentage of Population Employed in Farming, Fishing & Forestry in Deland, FL?
32724 has the Highest Percentage of Population Employed in Farming, Fishing & Forestry in Deland, FL with 0.61%.
What is the Percentage of Population Employed in Farming, Fishing & Forestry in Deland, FL?
Percentage of Population Employed in Farming, Fishing & Forestry in Deland is 0.11%.
What is the Percentage of Population Employed in Farming, Fishing & Forestry in Florida?
Percentage of Population Employed in Farming, Fishing & Forestry in Florida is 0.47%.
What is the Percentage of Population Employed in Farming, Fishing & Forestry in the United States?
Percentage of Population Employed in Farming, Fishing & Forestry in the United States is 0.61%.