Zip Codes with the Highest Percentage of Population Employed in Health Diagnosing & Treating in Defuniak Springs, FL
RELATED REPORTS & OPTIONS
Health Diagnosing & Treating
Defuniak Springs
Compare Zip Codes
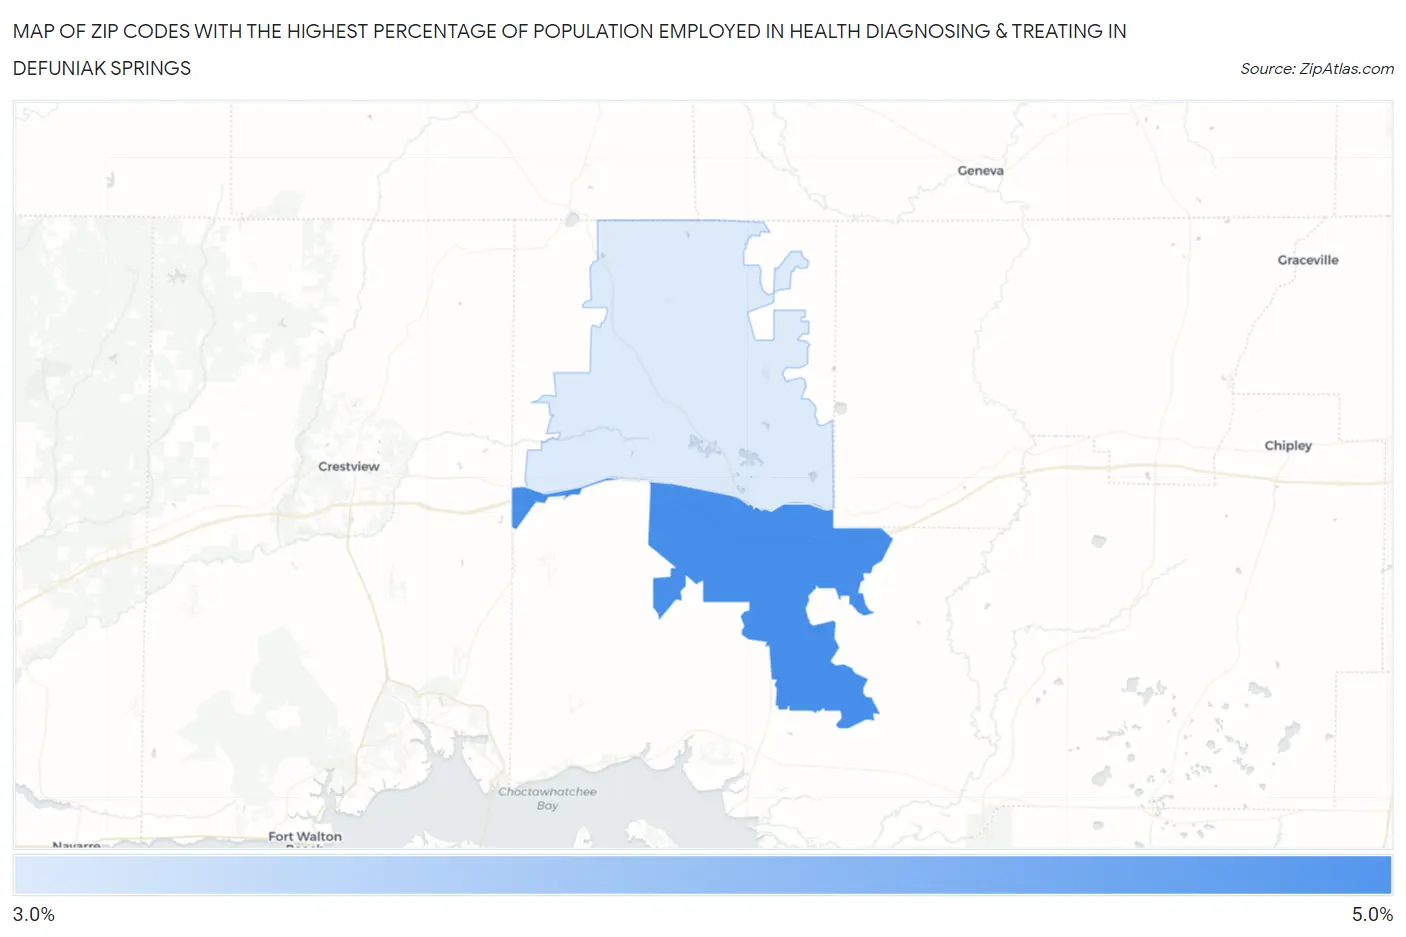
Map of Zip Codes with the Highest Percentage of Population Employed in Health Diagnosing & Treating in Defuniak Springs
3.9%
4.3%
Zip Codes with the Highest Percentage of Population Employed in Health Diagnosing & Treating in Defuniak Springs, FL
| Zip Code | % Employed | vs State | vs National | |
| 1. | 32435 | 4.3% | 6.4%(-2.16)#740 | 6.2%(-1.95)#20,380 |
| 2. | 32433 | 3.9% | 6.4%(-2.59)#790 | 6.2%(-2.39)#21,829 |
1
Common Questions
What are the Top Zip Codes with the Highest Percentage of Population Employed in Health Diagnosing & Treating in Defuniak Springs, FL?
Top Zip Codes with the Highest Percentage of Population Employed in Health Diagnosing & Treating in Defuniak Springs, FL are:
What zip code has the Highest Percentage of Population Employed in Health Diagnosing & Treating in Defuniak Springs, FL?
32435 has the Highest Percentage of Population Employed in Health Diagnosing & Treating in Defuniak Springs, FL with 4.3%.
What is the Percentage of Population Employed in Health Diagnosing & Treating in Defuniak Springs, FL?
Percentage of Population Employed in Health Diagnosing & Treating in Defuniak Springs is 3.2%.
What is the Percentage of Population Employed in Health Diagnosing & Treating in Florida?
Percentage of Population Employed in Health Diagnosing & Treating in Florida is 6.4%.
What is the Percentage of Population Employed in Health Diagnosing & Treating in the United States?
Percentage of Population Employed in Health Diagnosing & Treating in the United States is 6.2%.