Immigrants from Bangladesh vs Immigrants from Burma/Myanmar Average Family Size
COMPARE
Immigrants from Bangladesh
Immigrants from Burma/Myanmar
Average Family Size
Average Family Size Comparison
Immigrants from Bangladesh
Immigrants from Burma/Myanmar
3.36
AVERAGE FAMILY SIZE
100.0/ 100
METRIC RATING
50th/ 347
METRIC RANK
3.29
AVERAGE FAMILY SIZE
98.6/ 100
METRIC RATING
101st/ 347
METRIC RANK
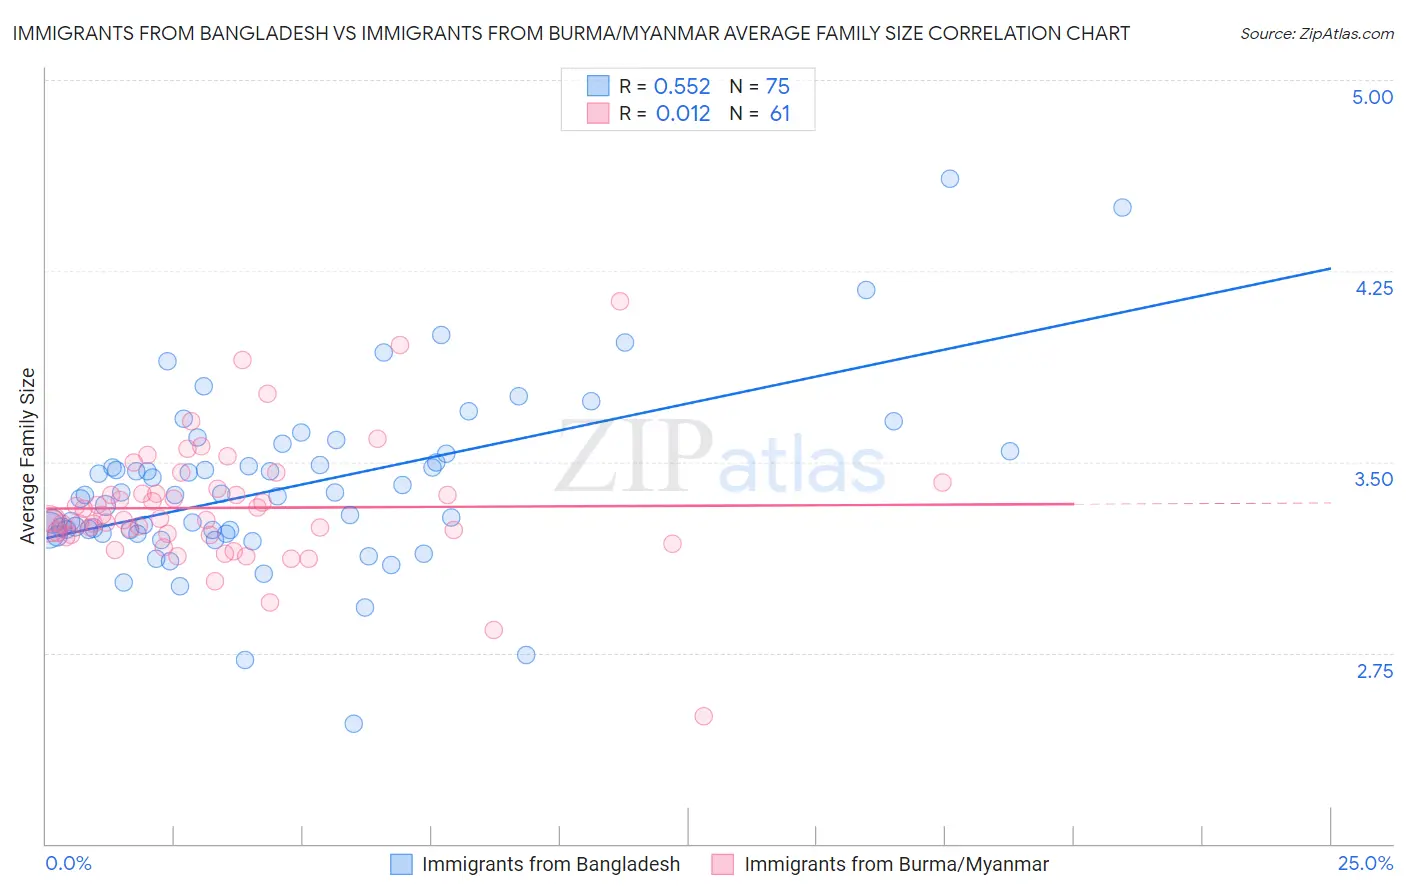
Immigrants from Bangladesh vs Immigrants from Burma/Myanmar Average Family Size Correlation Chart
The statistical analysis conducted on geographies consisting of 203,581,680 people shows a substantial positive correlation between the proportion of Immigrants from Bangladesh and average family size in the United States with a correlation coefficient (R) of 0.552 and weighted average of 3.36. Similarly, the statistical analysis conducted on geographies consisting of 172,260,665 people shows no correlation between the proportion of Immigrants from Burma/Myanmar and average family size in the United States with a correlation coefficient (R) of 0.012 and weighted average of 3.29, a difference of 2.2%.
Average Family Size Correlation Summary
| Measurement | Immigrants from Bangladesh | Immigrants from Burma/Myanmar |
| Minimum | 2.47 | 2.50 |
| Maximum | 4.61 | 4.13 |
| Range | 2.14 | 1.63 |
| Mean | 3.40 | 3.32 |
| Median | 3.37 | 3.27 |
| Interquartile 25% (IQ1) | 3.22 | 3.21 |
| Interquartile 75% (IQ3) | 3.53 | 3.39 |
| Interquartile Range (IQR) | 0.31 | 0.17 |
| Standard Deviation (Sample) | 0.34 | 0.25 |
| Standard Deviation (Population) | 0.34 | 0.24 |
Similar Demographics by Average Family Size
Demographics Similar to Immigrants from Bangladesh by Average Family Size
In terms of average family size, the demographic groups most similar to Immigrants from Bangladesh are Nicaraguan (3.36, a difference of 0.070%), Fijian (3.36, a difference of 0.13%), Bangladeshi (3.37, a difference of 0.14%), Korean (3.36, a difference of 0.16%), and Immigrants from South Eastern Asia (3.36, a difference of 0.18%).
| Demographics | Rating | Rank | Average Family Size |
| Immigrants | Philippines | 100.0 /100 | #43 | Exceptional 3.37 |
| Alaska Natives | 100.0 /100 | #44 | Exceptional 3.37 |
| Shoshone | 100.0 /100 | #45 | Exceptional 3.37 |
| Haitians | 100.0 /100 | #46 | Exceptional 3.37 |
| Vietnamese | 100.0 /100 | #47 | Exceptional 3.37 |
| Immigrants | Nicaragua | 100.0 /100 | #48 | Exceptional 3.37 |
| Bangladeshis | 100.0 /100 | #49 | Exceptional 3.37 |
| Immigrants | Bangladesh | 100.0 /100 | #50 | Exceptional 3.36 |
| Nicaraguans | 100.0 /100 | #51 | Exceptional 3.36 |
| Fijians | 100.0 /100 | #52 | Exceptional 3.36 |
| Koreans | 100.0 /100 | #53 | Exceptional 3.36 |
| Immigrants | South Eastern Asia | 100.0 /100 | #54 | Exceptional 3.36 |
| Immigrants | Honduras | 100.0 /100 | #55 | Exceptional 3.36 |
| Immigrants | Dominican Republic | 100.0 /100 | #56 | Exceptional 3.35 |
| Sri Lankans | 100.0 /100 | #57 | Exceptional 3.35 |
Demographics Similar to Immigrants from Burma/Myanmar by Average Family Size
In terms of average family size, the demographic groups most similar to Immigrants from Burma/Myanmar are West Indian (3.29, a difference of 0.010%), Nigerian (3.29, a difference of 0.020%), Guamanian/Chamorro (3.29, a difference of 0.020%), Immigrants from Oceania (3.29, a difference of 0.030%), and Barbadian (3.29, a difference of 0.030%).
| Demographics | Rating | Rank | Average Family Size |
| Sierra Leoneans | 99.0 /100 | #94 | Exceptional 3.30 |
| Immigrants | Lebanon | 99.0 /100 | #95 | Exceptional 3.30 |
| U.S. Virgin Islanders | 98.8 /100 | #96 | Exceptional 3.29 |
| Immigrants | Oceania | 98.7 /100 | #97 | Exceptional 3.29 |
| Barbadians | 98.6 /100 | #98 | Exceptional 3.29 |
| Nigerians | 98.6 /100 | #99 | Exceptional 3.29 |
| Guamanians/Chamorros | 98.6 /100 | #100 | Exceptional 3.29 |
| Immigrants | Burma/Myanmar | 98.6 /100 | #101 | Exceptional 3.29 |
| West Indians | 98.5 /100 | #102 | Exceptional 3.29 |
| Immigrants | Western Africa | 98.4 /100 | #103 | Exceptional 3.29 |
| Bolivians | 98.3 /100 | #104 | Exceptional 3.29 |
| Immigrants | Ghana | 98.1 /100 | #105 | Exceptional 3.29 |
| Paiute | 98.0 /100 | #106 | Exceptional 3.29 |
| Ghanaians | 98.0 /100 | #107 | Exceptional 3.29 |
| Asians | 97.0 /100 | #108 | Exceptional 3.28 |