Paraguayan vs Immigrants from Burma/Myanmar Average Family Size
COMPARE
Paraguayan
Immigrants from Burma/Myanmar
Average Family Size
Average Family Size Comparison
Paraguayans
Immigrants from Burma/Myanmar
3.20
AVERAGE FAMILY SIZE
16.3/ 100
METRIC RATING
205th/ 347
METRIC RANK
3.29
AVERAGE FAMILY SIZE
98.6/ 100
METRIC RATING
101st/ 347
METRIC RANK
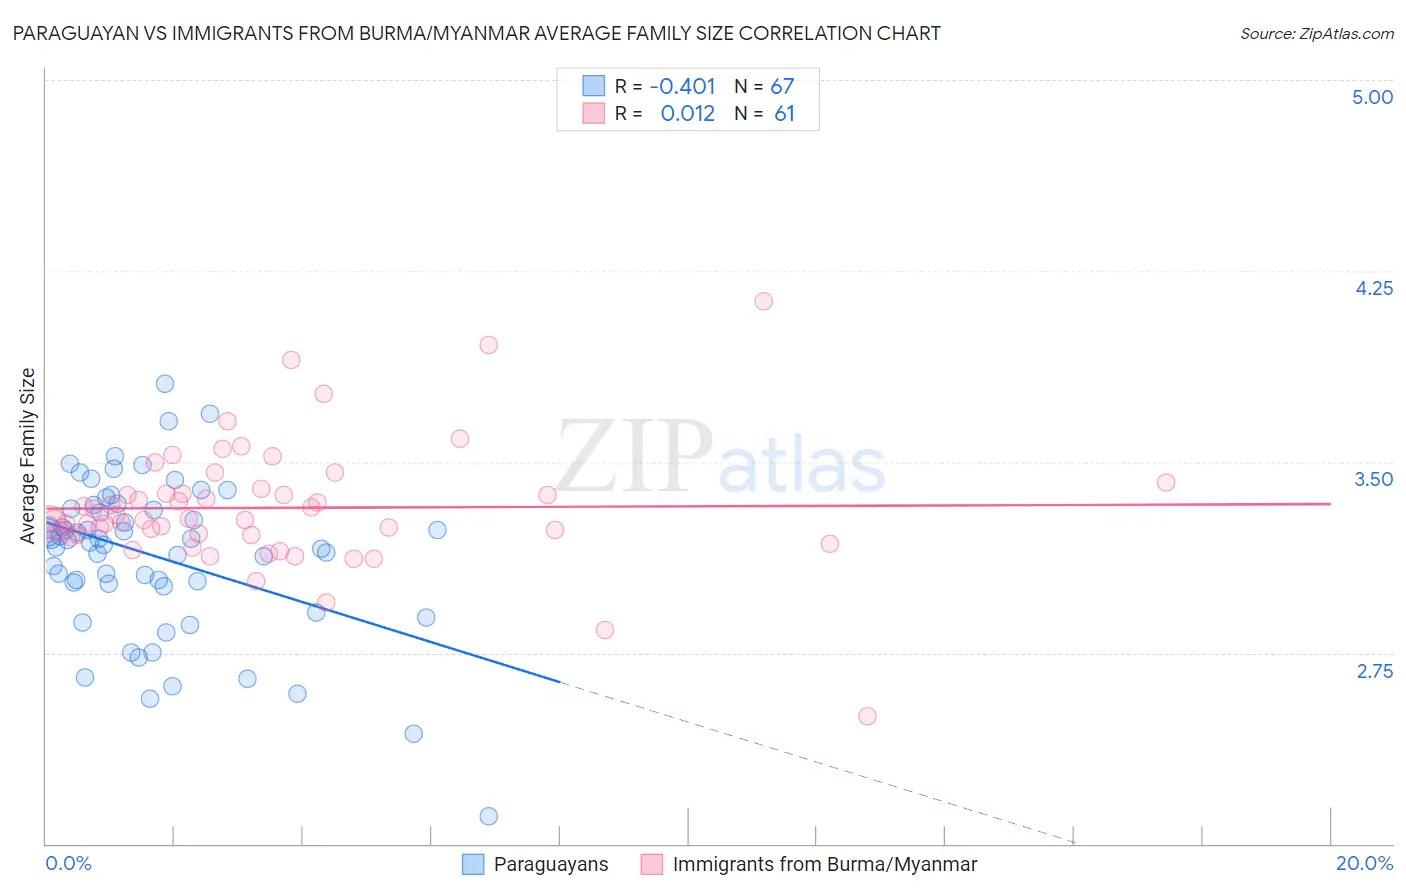
Paraguayan vs Immigrants from Burma/Myanmar Average Family Size Correlation Chart
The statistical analysis conducted on geographies consisting of 95,095,397 people shows a moderate negative correlation between the proportion of Paraguayans and average family size in the United States with a correlation coefficient (R) of -0.401 and weighted average of 3.20. Similarly, the statistical analysis conducted on geographies consisting of 172,260,665 people shows no correlation between the proportion of Immigrants from Burma/Myanmar and average family size in the United States with a correlation coefficient (R) of 0.012 and weighted average of 3.29, a difference of 2.7%.
Average Family Size Correlation Summary
| Measurement | Paraguayan | Immigrants from Burma/Myanmar |
| Minimum | 2.11 | 2.50 |
| Maximum | 3.80 | 4.13 |
| Range | 1.69 | 1.63 |
| Mean | 3.13 | 3.32 |
| Median | 3.19 | 3.27 |
| Interquartile 25% (IQ1) | 3.02 | 3.21 |
| Interquartile 75% (IQ3) | 3.32 | 3.39 |
| Interquartile Range (IQR) | 0.29 | 0.17 |
| Standard Deviation (Sample) | 0.31 | 0.25 |
| Standard Deviation (Population) | 0.30 | 0.24 |
Similar Demographics by Average Family Size
Demographics Similar to Paraguayans by Average Family Size
In terms of average family size, the demographic groups most similar to Paraguayans are Immigrants from Poland (3.20, a difference of 0.010%), Immigrants from Cabo Verde (3.20, a difference of 0.010%), Immigrants from Nepal (3.21, a difference of 0.060%), Immigrants from Morocco (3.21, a difference of 0.070%), and Immigrants from India (3.21, a difference of 0.070%).
| Demographics | Rating | Rank | Average Family Size |
| Immigrants | Azores | 21.7 /100 | #198 | Fair 3.21 |
| Hmong | 20.7 /100 | #199 | Fair 3.21 |
| Immigrants | Kenya | 19.2 /100 | #200 | Poor 3.21 |
| Immigrants | Morocco | 18.5 /100 | #201 | Poor 3.21 |
| Immigrants | India | 18.5 /100 | #202 | Poor 3.21 |
| Immigrants | Nepal | 18.1 /100 | #203 | Poor 3.21 |
| Immigrants | Poland | 16.6 /100 | #204 | Poor 3.20 |
| Paraguayans | 16.3 /100 | #205 | Poor 3.20 |
| Immigrants | Cabo Verde | 16.0 /100 | #206 | Poor 3.20 |
| Filipinos | 13.6 /100 | #207 | Poor 3.20 |
| Chippewa | 13.3 /100 | #208 | Poor 3.20 |
| Sudanese | 13.3 /100 | #209 | Poor 3.20 |
| Zimbabweans | 12.6 /100 | #210 | Poor 3.20 |
| Immigrants | Iran | 12.1 /100 | #211 | Poor 3.20 |
| Creek | 12.1 /100 | #212 | Poor 3.20 |
Demographics Similar to Immigrants from Burma/Myanmar by Average Family Size
In terms of average family size, the demographic groups most similar to Immigrants from Burma/Myanmar are West Indian (3.29, a difference of 0.010%), Nigerian (3.29, a difference of 0.020%), Guamanian/Chamorro (3.29, a difference of 0.020%), Immigrants from Oceania (3.29, a difference of 0.030%), and Barbadian (3.29, a difference of 0.030%).
| Demographics | Rating | Rank | Average Family Size |
| Sierra Leoneans | 99.0 /100 | #94 | Exceptional 3.30 |
| Immigrants | Lebanon | 99.0 /100 | #95 | Exceptional 3.30 |
| U.S. Virgin Islanders | 98.8 /100 | #96 | Exceptional 3.29 |
| Immigrants | Oceania | 98.7 /100 | #97 | Exceptional 3.29 |
| Barbadians | 98.6 /100 | #98 | Exceptional 3.29 |
| Nigerians | 98.6 /100 | #99 | Exceptional 3.29 |
| Guamanians/Chamorros | 98.6 /100 | #100 | Exceptional 3.29 |
| Immigrants | Burma/Myanmar | 98.6 /100 | #101 | Exceptional 3.29 |
| West Indians | 98.5 /100 | #102 | Exceptional 3.29 |
| Immigrants | Western Africa | 98.4 /100 | #103 | Exceptional 3.29 |
| Bolivians | 98.3 /100 | #104 | Exceptional 3.29 |
| Immigrants | Ghana | 98.1 /100 | #105 | Exceptional 3.29 |
| Paiute | 98.0 /100 | #106 | Exceptional 3.29 |
| Ghanaians | 98.0 /100 | #107 | Exceptional 3.29 |
| Asians | 97.0 /100 | #108 | Exceptional 3.28 |