Tlingit-Haida vs Immigrants from Burma/Myanmar Unemployment Among Ages 60 to 64 years
COMPARE
Tlingit-Haida
Immigrants from Burma/Myanmar
Unemployment Among Ages 60 to 64 years
Unemployment Among Ages 60 to 64 years Comparison
Tlingit-Haida
Immigrants from Burma/Myanmar
6.4%
UNEMPLOYMENT AMONG AGES 60 TO 64 YEARS
0.0/ 100
METRIC RATING
339th/ 347
METRIC RANK
4.4%
UNEMPLOYMENT AMONG AGES 60 TO 64 YEARS
100.0/ 100
METRIC RATING
24th/ 347
METRIC RANK
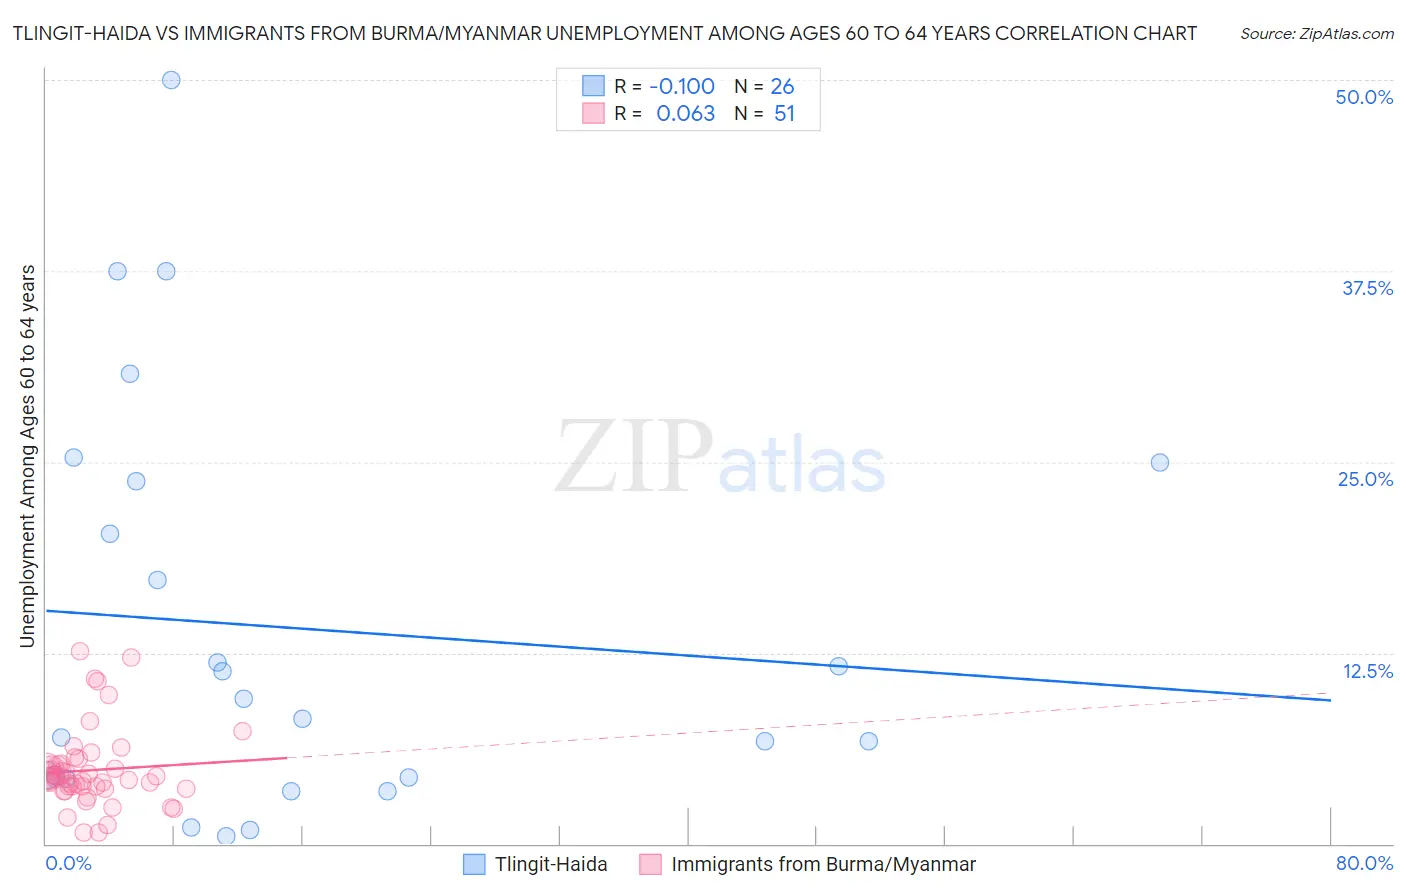
Tlingit-Haida vs Immigrants from Burma/Myanmar Unemployment Among Ages 60 to 64 years Correlation Chart
The statistical analysis conducted on geographies consisting of 58,290,195 people shows a slight negative correlation between the proportion of Tlingit-Haida and unemployment rate among population between the ages 60 and 64 in the United States with a correlation coefficient (R) of -0.100 and weighted average of 6.4%. Similarly, the statistical analysis conducted on geographies consisting of 165,064,004 people shows a slight positive correlation between the proportion of Immigrants from Burma/Myanmar and unemployment rate among population between the ages 60 and 64 in the United States with a correlation coefficient (R) of 0.063 and weighted average of 4.4%, a difference of 44.6%.
Unemployment Among Ages 60 to 64 years Correlation Summary
| Measurement | Tlingit-Haida | Immigrants from Burma/Myanmar |
| Minimum | 0.50% | 0.70% |
| Maximum | 50.0% | 12.6% |
| Range | 49.5% | 11.9% |
| Mean | 14.1% | 4.8% |
| Median | 8.8% | 4.3% |
| Interquartile 25% (IQ1) | 4.3% | 3.6% |
| Interquartile 75% (IQ3) | 23.7% | 5.2% |
| Interquartile Range (IQR) | 19.4% | 1.6% |
| Standard Deviation (Sample) | 13.3% | 2.6% |
| Standard Deviation (Population) | 13.0% | 2.5% |
Similar Demographics by Unemployment Among Ages 60 to 64 years
Demographics Similar to Tlingit-Haida by Unemployment Among Ages 60 to 64 years
In terms of unemployment among ages 60 to 64 years, the demographic groups most similar to Tlingit-Haida are Arapaho (6.3%, a difference of 1.4%), Navajo (6.3%, a difference of 1.9%), Kiowa (6.2%, a difference of 3.0%), Vietnamese (6.1%, a difference of 5.0%), and Puerto Rican (6.1%, a difference of 5.2%).
| Demographics | Rating | Rank | Unemployment Among Ages 60 to 64 years |
| Dominicans | 0.0 /100 | #332 | Tragic 6.0% |
| Immigrants | Dominican Republic | 0.0 /100 | #333 | Tragic 6.0% |
| Puerto Ricans | 0.0 /100 | #334 | Tragic 6.1% |
| Vietnamese | 0.0 /100 | #335 | Tragic 6.1% |
| Kiowa | 0.0 /100 | #336 | Tragic 6.2% |
| Navajo | 0.0 /100 | #337 | Tragic 6.3% |
| Arapaho | 0.0 /100 | #338 | Tragic 6.3% |
| Tlingit-Haida | 0.0 /100 | #339 | Tragic 6.4% |
| Pueblo | 0.0 /100 | #340 | Tragic 6.7% |
| Yuman | 0.0 /100 | #341 | Tragic 6.8% |
| Aleuts | 0.0 /100 | #342 | Tragic 6.8% |
| Immigrants | Yemen | 0.0 /100 | #343 | Tragic 6.8% |
| Alaska Natives | 0.0 /100 | #344 | Tragic 7.6% |
| Alaskan Athabascans | 0.0 /100 | #345 | Tragic 8.4% |
| Inupiat | 0.0 /100 | #346 | Tragic 9.6% |
Demographics Similar to Immigrants from Burma/Myanmar by Unemployment Among Ages 60 to 64 years
In terms of unemployment among ages 60 to 64 years, the demographic groups most similar to Immigrants from Burma/Myanmar are Immigrants from Zaire (4.4%, a difference of 0.23%), Cape Verdean (4.4%, a difference of 0.43%), Afghan (4.4%, a difference of 0.51%), Immigrants from Cabo Verde (4.4%, a difference of 0.51%), and Yugoslavian (4.4%, a difference of 0.64%).
| Demographics | Rating | Rank | Unemployment Among Ages 60 to 64 years |
| Immigrants | Afghanistan | 100.0 /100 | #17 | Exceptional 4.4% |
| Slovenes | 100.0 /100 | #18 | Exceptional 4.4% |
| Tsimshian | 100.0 /100 | #19 | Exceptional 4.4% |
| Afghans | 100.0 /100 | #20 | Exceptional 4.4% |
| Immigrants | Cabo Verde | 100.0 /100 | #21 | Exceptional 4.4% |
| Cape Verdeans | 100.0 /100 | #22 | Exceptional 4.4% |
| Immigrants | Zaire | 100.0 /100 | #23 | Exceptional 4.4% |
| Immigrants | Burma/Myanmar | 100.0 /100 | #24 | Exceptional 4.4% |
| Yugoslavians | 100.0 /100 | #25 | Exceptional 4.4% |
| Czechs | 100.0 /100 | #26 | Exceptional 4.4% |
| Immigrants | Iraq | 100.0 /100 | #27 | Exceptional 4.5% |
| Immigrants | Nepal | 100.0 /100 | #28 | Exceptional 4.5% |
| Cubans | 100.0 /100 | #29 | Exceptional 4.5% |
| Immigrants | Venezuela | 100.0 /100 | #30 | Exceptional 4.5% |
| Immigrants | Eritrea | 100.0 /100 | #31 | Exceptional 4.5% |