Tlingit-Haida vs Immigrants from Burma/Myanmar Male Disability
COMPARE
Tlingit-Haida
Immigrants from Burma/Myanmar
Male Disability
Male Disability Comparison
Tlingit-Haida
Immigrants from Burma/Myanmar
13.8%
MALE DISABILITY
0.0/ 100
METRIC RATING
320th/ 347
METRIC RANK
11.2%
MALE DISABILITY
50.4/ 100
METRIC RATING
173rd/ 347
METRIC RANK
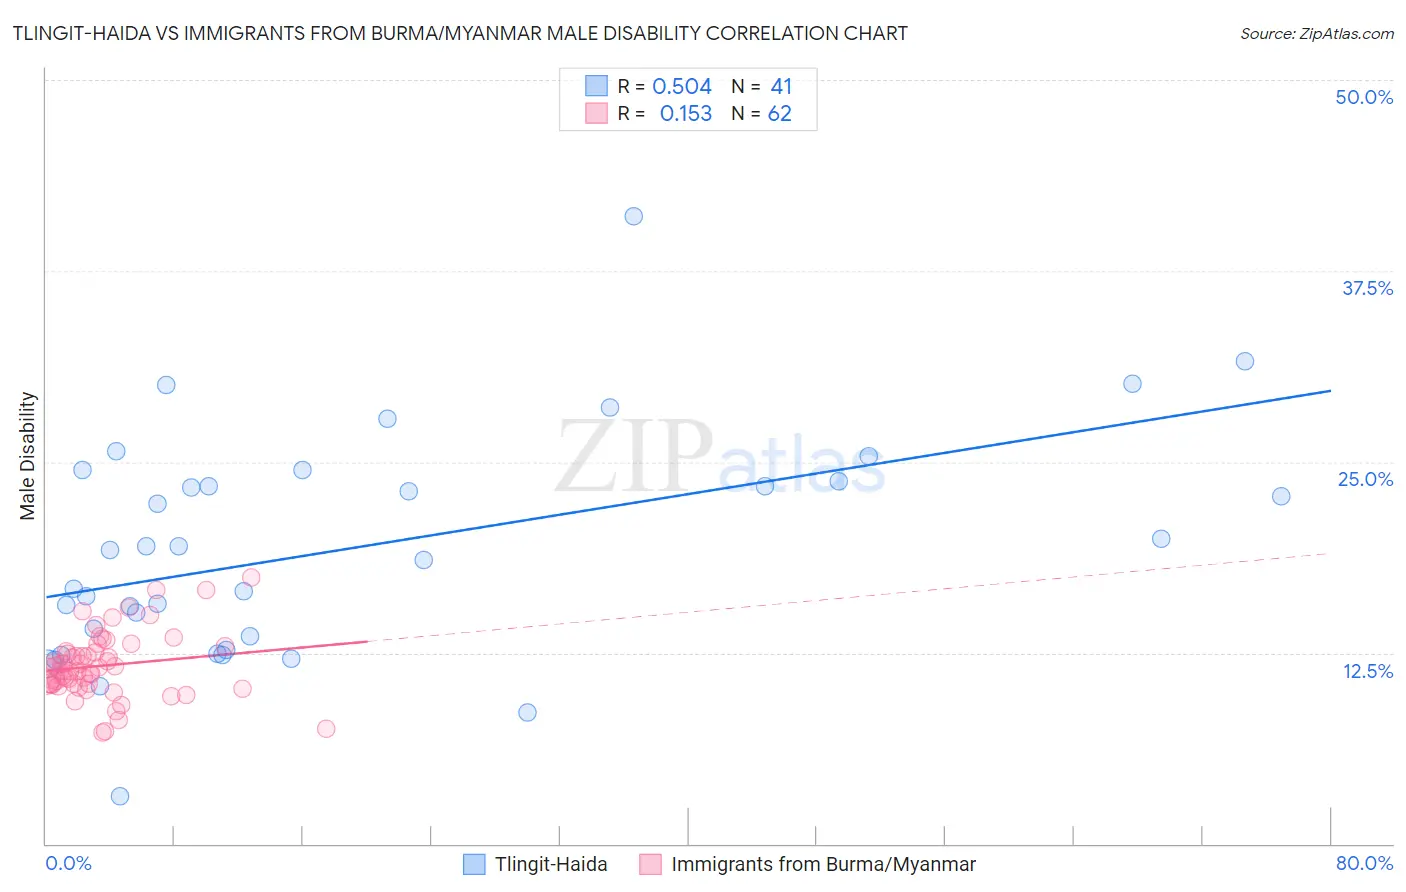
Tlingit-Haida vs Immigrants from Burma/Myanmar Male Disability Correlation Chart
The statistical analysis conducted on geographies consisting of 60,851,832 people shows a substantial positive correlation between the proportion of Tlingit-Haida and percentage of males with a disability in the United States with a correlation coefficient (R) of 0.504 and weighted average of 13.8%. Similarly, the statistical analysis conducted on geographies consisting of 172,332,425 people shows a poor positive correlation between the proportion of Immigrants from Burma/Myanmar and percentage of males with a disability in the United States with a correlation coefficient (R) of 0.153 and weighted average of 11.2%, a difference of 23.4%.
Male Disability Correlation Summary
| Measurement | Tlingit-Haida | Immigrants from Burma/Myanmar |
| Minimum | 3.1% | 7.3% |
| Maximum | 41.1% | 17.5% |
| Range | 38.0% | 10.2% |
| Mean | 19.4% | 11.7% |
| Median | 19.2% | 11.4% |
| Interquartile 25% (IQ1) | 13.1% | 10.5% |
| Interquartile 75% (IQ3) | 24.1% | 12.6% |
| Interquartile Range (IQR) | 11.0% | 2.1% |
| Standard Deviation (Sample) | 7.4% | 2.2% |
| Standard Deviation (Population) | 7.3% | 2.1% |
Similar Demographics by Male Disability
Demographics Similar to Tlingit-Haida by Male Disability
In terms of male disability, the demographic groups most similar to Tlingit-Haida are Shoshone (13.8%, a difference of 0.050%), American (13.8%, a difference of 0.49%), Cree (13.7%, a difference of 0.90%), Paiute (13.7%, a difference of 1.1%), and Apache (14.0%, a difference of 1.2%).
| Demographics | Rating | Rank | Male Disability |
| Puget Sound Salish | 0.0 /100 | #313 | Tragic 13.5% |
| Aleuts | 0.0 /100 | #314 | Tragic 13.5% |
| Iroquois | 0.0 /100 | #315 | Tragic 13.6% |
| Alaska Natives | 0.0 /100 | #316 | Tragic 13.6% |
| Paiute | 0.0 /100 | #317 | Tragic 13.7% |
| Cree | 0.0 /100 | #318 | Tragic 13.7% |
| Americans | 0.0 /100 | #319 | Tragic 13.8% |
| Tlingit-Haida | 0.0 /100 | #320 | Tragic 13.8% |
| Shoshone | 0.0 /100 | #321 | Tragic 13.8% |
| Apache | 0.0 /100 | #322 | Tragic 14.0% |
| Osage | 0.0 /100 | #323 | Tragic 14.0% |
| Comanche | 0.0 /100 | #324 | Tragic 14.1% |
| Ottawa | 0.0 /100 | #325 | Tragic 14.1% |
| Natives/Alaskans | 0.0 /100 | #326 | Tragic 14.2% |
| Potawatomi | 0.0 /100 | #327 | Tragic 14.2% |
Demographics Similar to Immigrants from Burma/Myanmar by Male Disability
In terms of male disability, the demographic groups most similar to Immigrants from Burma/Myanmar are Romanian (11.2%, a difference of 0.020%), Maltese (11.2%, a difference of 0.020%), Immigrants from Honduras (11.2%, a difference of 0.10%), Haitian (11.2%, a difference of 0.12%), and New Zealander (11.2%, a difference of 0.14%).
| Demographics | Rating | Rank | Male Disability |
| Immigrants | Hungary | 61.2 /100 | #166 | Good 11.1% |
| Immigrants | Southern Europe | 54.4 /100 | #167 | Average 11.2% |
| Immigrants | Latin America | 54.0 /100 | #168 | Average 11.2% |
| Barbadians | 53.4 /100 | #169 | Average 11.2% |
| New Zealanders | 52.9 /100 | #170 | Average 11.2% |
| Haitians | 52.5 /100 | #171 | Average 11.2% |
| Romanians | 50.7 /100 | #172 | Average 11.2% |
| Immigrants | Burma/Myanmar | 50.4 /100 | #173 | Average 11.2% |
| Maltese | 50.0 /100 | #174 | Average 11.2% |
| Immigrants | Honduras | 48.7 /100 | #175 | Average 11.2% |
| Syrians | 46.6 /100 | #176 | Average 11.2% |
| Immigrants | Norway | 44.2 /100 | #177 | Average 11.3% |
| Australians | 42.2 /100 | #178 | Average 11.3% |
| Immigrants | Caribbean | 41.4 /100 | #179 | Average 11.3% |
| Hondurans | 41.1 /100 | #180 | Average 11.3% |