Panamanian vs Immigrants from Burma/Myanmar Average Family Size
COMPARE
Panamanian
Immigrants from Burma/Myanmar
Average Family Size
Average Family Size Comparison
Panamanians
Immigrants from Burma/Myanmar
3.25
AVERAGE FAMILY SIZE
84.2/ 100
METRIC RATING
135th/ 347
METRIC RANK
3.29
AVERAGE FAMILY SIZE
98.6/ 100
METRIC RATING
101st/ 347
METRIC RANK
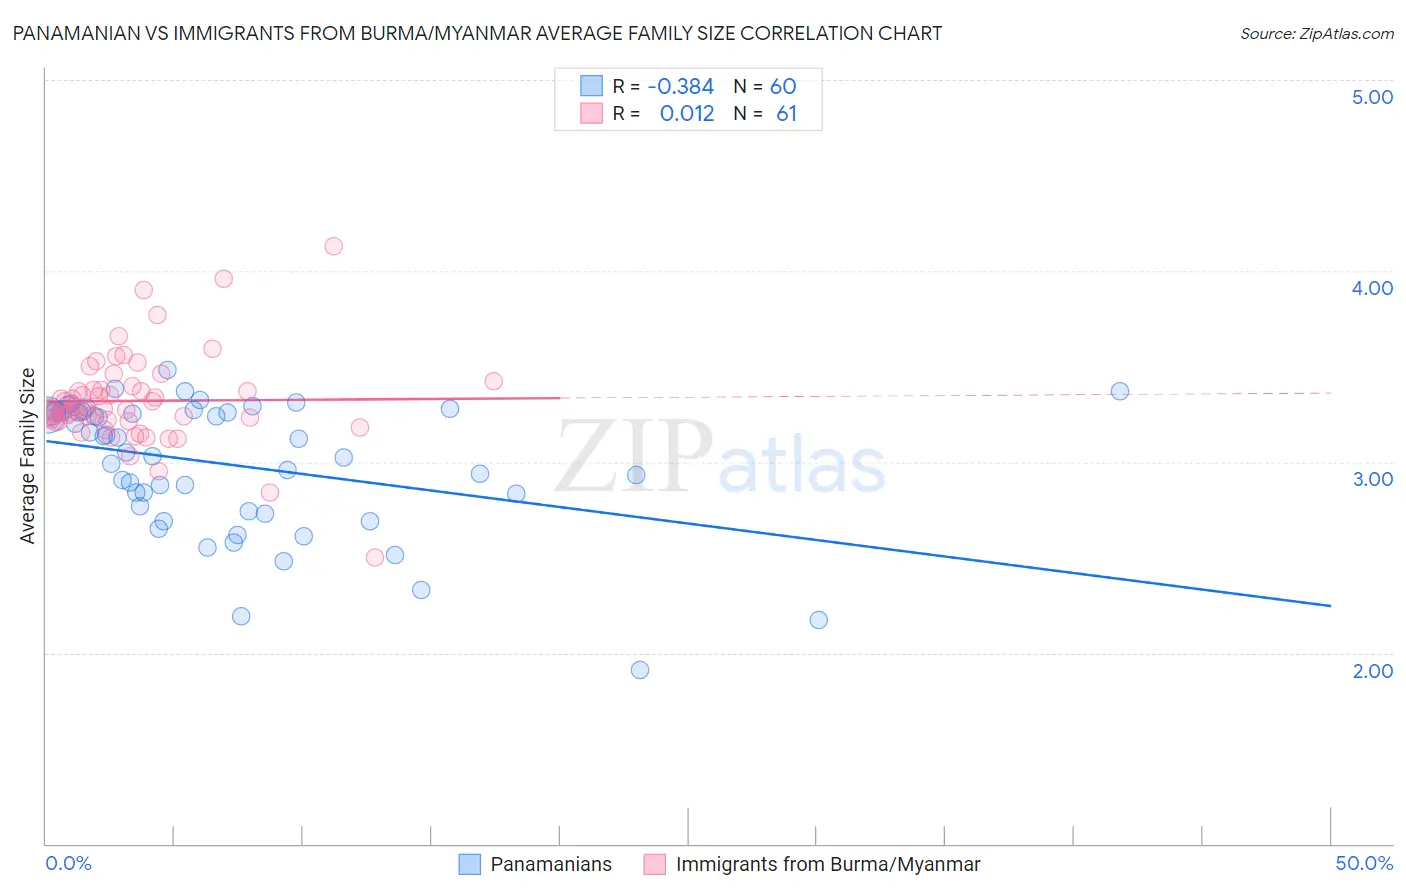
Panamanian vs Immigrants from Burma/Myanmar Average Family Size Correlation Chart
The statistical analysis conducted on geographies consisting of 281,072,582 people shows a mild negative correlation between the proportion of Panamanians and average family size in the United States with a correlation coefficient (R) of -0.384 and weighted average of 3.25. Similarly, the statistical analysis conducted on geographies consisting of 172,260,665 people shows no correlation between the proportion of Immigrants from Burma/Myanmar and average family size in the United States with a correlation coefficient (R) of 0.012 and weighted average of 3.29, a difference of 1.1%.
Average Family Size Correlation Summary
| Measurement | Panamanian | Immigrants from Burma/Myanmar |
| Minimum | 1.91 | 2.50 |
| Maximum | 3.48 | 4.13 |
| Range | 1.57 | 1.63 |
| Mean | 2.98 | 3.32 |
| Median | 3.08 | 3.27 |
| Interquartile 25% (IQ1) | 2.75 | 3.21 |
| Interquartile 75% (IQ3) | 3.26 | 3.39 |
| Interquartile Range (IQR) | 0.51 | 0.17 |
| Standard Deviation (Sample) | 0.35 | 0.25 |
| Standard Deviation (Population) | 0.34 | 0.24 |
Similar Demographics by Average Family Size
Demographics Similar to Panamanians by Average Family Size
In terms of average family size, the demographic groups most similar to Panamanians are African (3.25, a difference of 0.020%), Comanche (3.25, a difference of 0.050%), Immigrants from Middle Africa (3.25, a difference of 0.060%), Immigrants from Venezuela (3.26, a difference of 0.070%), and Cuban (3.25, a difference of 0.080%).
| Demographics | Rating | Rank | Average Family Size |
| Colombians | 89.9 /100 | #128 | Excellent 3.26 |
| Immigrants | Hong Kong | 88.6 /100 | #129 | Excellent 3.26 |
| Laotians | 88.5 /100 | #130 | Excellent 3.26 |
| Immigrants | Western Asia | 87.7 /100 | #131 | Excellent 3.26 |
| Costa Ricans | 86.8 /100 | #132 | Excellent 3.26 |
| Immigrants | Venezuela | 86.3 /100 | #133 | Excellent 3.26 |
| Africans | 84.9 /100 | #134 | Excellent 3.25 |
| Panamanians | 84.2 /100 | #135 | Excellent 3.25 |
| Comanche | 82.8 /100 | #136 | Excellent 3.25 |
| Immigrants | Middle Africa | 82.4 /100 | #137 | Excellent 3.25 |
| Cubans | 81.8 /100 | #138 | Excellent 3.25 |
| Immigrants | Ethiopia | 81.6 /100 | #139 | Excellent 3.25 |
| Sub-Saharan Africans | 81.6 /100 | #140 | Excellent 3.25 |
| Venezuelans | 81.4 /100 | #141 | Excellent 3.25 |
| Liberians | 81.2 /100 | #142 | Excellent 3.25 |
Demographics Similar to Immigrants from Burma/Myanmar by Average Family Size
In terms of average family size, the demographic groups most similar to Immigrants from Burma/Myanmar are West Indian (3.29, a difference of 0.010%), Nigerian (3.29, a difference of 0.020%), Guamanian/Chamorro (3.29, a difference of 0.020%), Immigrants from Oceania (3.29, a difference of 0.030%), and Barbadian (3.29, a difference of 0.030%).
| Demographics | Rating | Rank | Average Family Size |
| Sierra Leoneans | 99.0 /100 | #94 | Exceptional 3.30 |
| Immigrants | Lebanon | 99.0 /100 | #95 | Exceptional 3.30 |
| U.S. Virgin Islanders | 98.8 /100 | #96 | Exceptional 3.29 |
| Immigrants | Oceania | 98.7 /100 | #97 | Exceptional 3.29 |
| Barbadians | 98.6 /100 | #98 | Exceptional 3.29 |
| Nigerians | 98.6 /100 | #99 | Exceptional 3.29 |
| Guamanians/Chamorros | 98.6 /100 | #100 | Exceptional 3.29 |
| Immigrants | Burma/Myanmar | 98.6 /100 | #101 | Exceptional 3.29 |
| West Indians | 98.5 /100 | #102 | Exceptional 3.29 |
| Immigrants | Western Africa | 98.4 /100 | #103 | Exceptional 3.29 |
| Bolivians | 98.3 /100 | #104 | Exceptional 3.29 |
| Immigrants | Ghana | 98.1 /100 | #105 | Exceptional 3.29 |
| Paiute | 98.0 /100 | #106 | Exceptional 3.29 |
| Ghanaians | 98.0 /100 | #107 | Exceptional 3.29 |
| Asians | 97.0 /100 | #108 | Exceptional 3.28 |