Tlingit-Haida vs Immigrants from Burma/Myanmar Child Poverty Under the Age of 16
COMPARE
Tlingit-Haida
Immigrants from Burma/Myanmar
Child Poverty Under the Age of 16
Child Poverty Under the Age of 16 Comparison
Tlingit-Haida
Immigrants from Burma/Myanmar
14.9%
CHILD POVERTY UNDER THE AGE OF 16
94.1/ 100
METRIC RATING
109th/ 347
METRIC RANK
19.4%
CHILD POVERTY UNDER THE AGE OF 16
0.1/ 100
METRIC RATING
261st/ 347
METRIC RANK
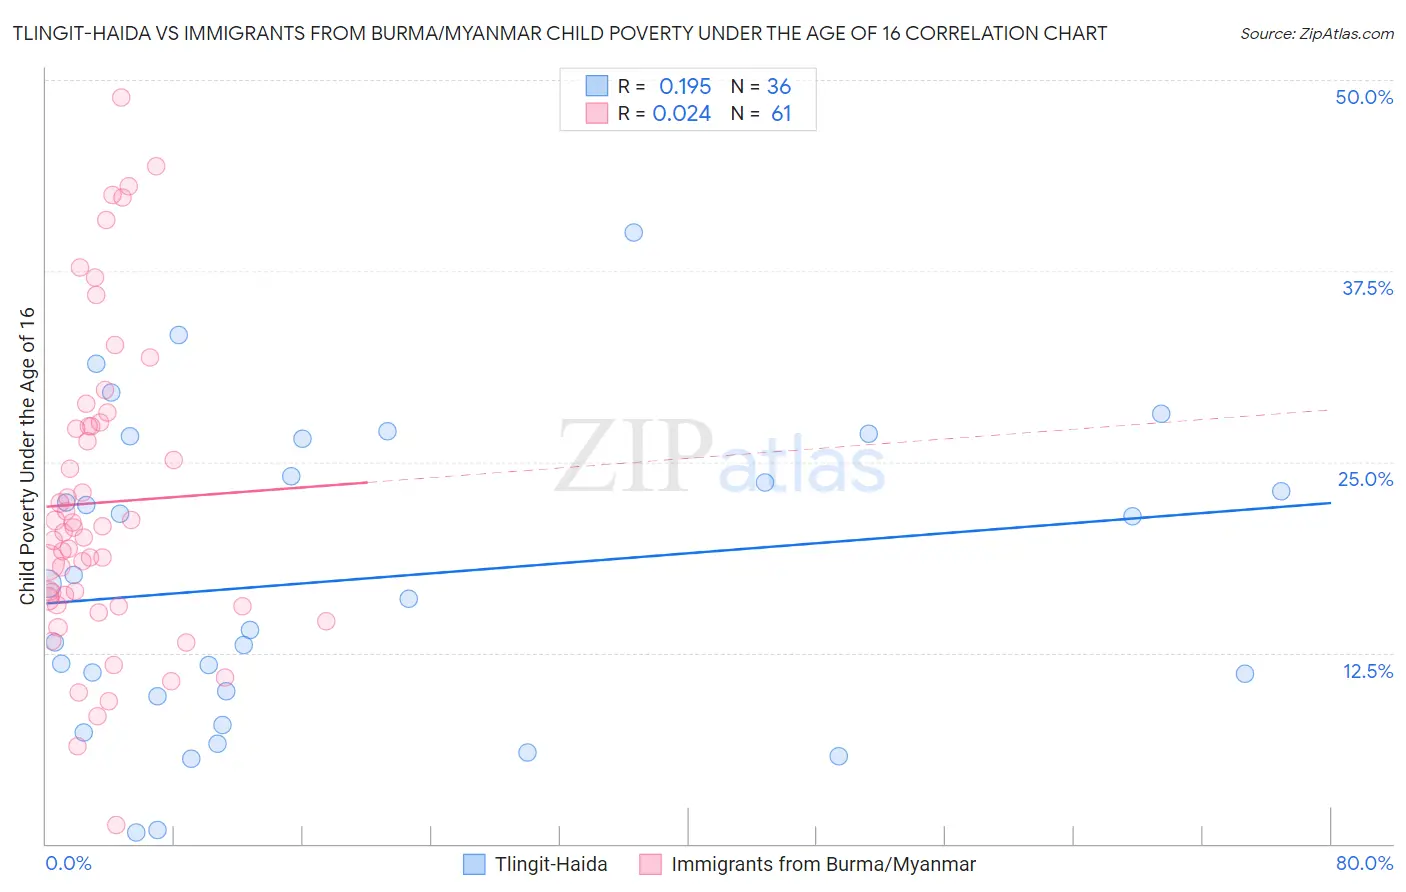
Tlingit-Haida vs Immigrants from Burma/Myanmar Child Poverty Under the Age of 16 Correlation Chart
The statistical analysis conducted on geographies consisting of 60,748,719 people shows a poor positive correlation between the proportion of Tlingit-Haida and poverty level among children under the age of 16 in the United States with a correlation coefficient (R) of 0.195 and weighted average of 14.9%. Similarly, the statistical analysis conducted on geographies consisting of 171,826,870 people shows no correlation between the proportion of Immigrants from Burma/Myanmar and poverty level among children under the age of 16 in the United States with a correlation coefficient (R) of 0.024 and weighted average of 19.4%, a difference of 30.3%.
Child Poverty Under the Age of 16 Correlation Summary
| Measurement | Tlingit-Haida | Immigrants from Burma/Myanmar |
| Minimum | 0.72% | 1.2% |
| Maximum | 40.0% | 48.9% |
| Range | 39.3% | 47.6% |
| Mean | 17.4% | 22.3% |
| Median | 16.5% | 20.4% |
| Interquartile 25% (IQ1) | 9.8% | 15.6% |
| Interquartile 75% (IQ3) | 25.3% | 27.5% |
| Interquartile Range (IQR) | 15.5% | 11.9% |
| Standard Deviation (Sample) | 9.8% | 10.2% |
| Standard Deviation (Population) | 9.6% | 10.1% |
Similar Demographics by Child Poverty Under the Age of 16
Demographics Similar to Tlingit-Haida by Child Poverty Under the Age of 16
In terms of child poverty under the age of 16, the demographic groups most similar to Tlingit-Haida are Jordanian (14.8%, a difference of 0.070%), Chilean (14.8%, a difference of 0.16%), Serbian (14.8%, a difference of 0.22%), English (14.9%, a difference of 0.34%), and Basque (14.8%, a difference of 0.35%).
| Demographics | Rating | Rank | Child Poverty Under the Age of 16 |
| Romanians | 95.0 /100 | #102 | Exceptional 14.8% |
| Immigrants | Egypt | 94.9 /100 | #103 | Exceptional 14.8% |
| Immigrants | England | 94.8 /100 | #104 | Exceptional 14.8% |
| Basques | 94.7 /100 | #105 | Exceptional 14.8% |
| Serbians | 94.5 /100 | #106 | Exceptional 14.8% |
| Chileans | 94.4 /100 | #107 | Exceptional 14.8% |
| Jordanians | 94.2 /100 | #108 | Exceptional 14.8% |
| Tlingit-Haida | 94.1 /100 | #109 | Exceptional 14.9% |
| English | 93.5 /100 | #110 | Exceptional 14.9% |
| Immigrants | Denmark | 93.5 /100 | #111 | Exceptional 14.9% |
| Irish | 93.4 /100 | #112 | Exceptional 14.9% |
| Belgians | 93.3 /100 | #113 | Exceptional 14.9% |
| Sri Lankans | 93.2 /100 | #114 | Exceptional 14.9% |
| Immigrants | Ukraine | 93.1 /100 | #115 | Exceptional 14.9% |
| Carpatho Rusyns | 93.1 /100 | #116 | Exceptional 14.9% |
Demographics Similar to Immigrants from Burma/Myanmar by Child Poverty Under the Age of 16
In terms of child poverty under the age of 16, the demographic groups most similar to Immigrants from Burma/Myanmar are Immigrants from Guyana (19.4%, a difference of 0.040%), Guyanese (19.3%, a difference of 0.080%), Mexican American Indian (19.3%, a difference of 0.18%), Vietnamese (19.4%, a difference of 0.36%), and Immigrants from Ecuador (19.4%, a difference of 0.42%).
| Demographics | Rating | Rank | Child Poverty Under the Age of 16 |
| Immigrants | Western Africa | 0.2 /100 | #254 | Tragic 19.2% |
| Trinidadians and Tobagonians | 0.2 /100 | #255 | Tragic 19.2% |
| Inupiat | 0.2 /100 | #256 | Tragic 19.2% |
| Ottawa | 0.2 /100 | #257 | Tragic 19.2% |
| Spanish Americans | 0.2 /100 | #258 | Tragic 19.2% |
| Mexican American Indians | 0.2 /100 | #259 | Tragic 19.3% |
| Guyanese | 0.2 /100 | #260 | Tragic 19.3% |
| Immigrants | Burma/Myanmar | 0.1 /100 | #261 | Tragic 19.4% |
| Immigrants | Guyana | 0.1 /100 | #262 | Tragic 19.4% |
| Vietnamese | 0.1 /100 | #263 | Tragic 19.4% |
| Immigrants | Ecuador | 0.1 /100 | #264 | Tragic 19.4% |
| Chickasaw | 0.1 /100 | #265 | Tragic 19.5% |
| Liberians | 0.1 /100 | #266 | Tragic 19.5% |
| Cherokee | 0.1 /100 | #267 | Tragic 19.5% |
| Jamaicans | 0.1 /100 | #268 | Tragic 19.7% |