Immigrants from Croatia vs Immigrants from Burma/Myanmar Average Family Size
COMPARE
Immigrants from Croatia
Immigrants from Burma/Myanmar
Average Family Size
Average Family Size Comparison
Immigrants from Croatia
Immigrants from Burma/Myanmar
3.14
AVERAGE FAMILY SIZE
0.2/ 100
METRIC RATING
294th/ 347
METRIC RANK
3.29
AVERAGE FAMILY SIZE
98.6/ 100
METRIC RATING
101st/ 347
METRIC RANK
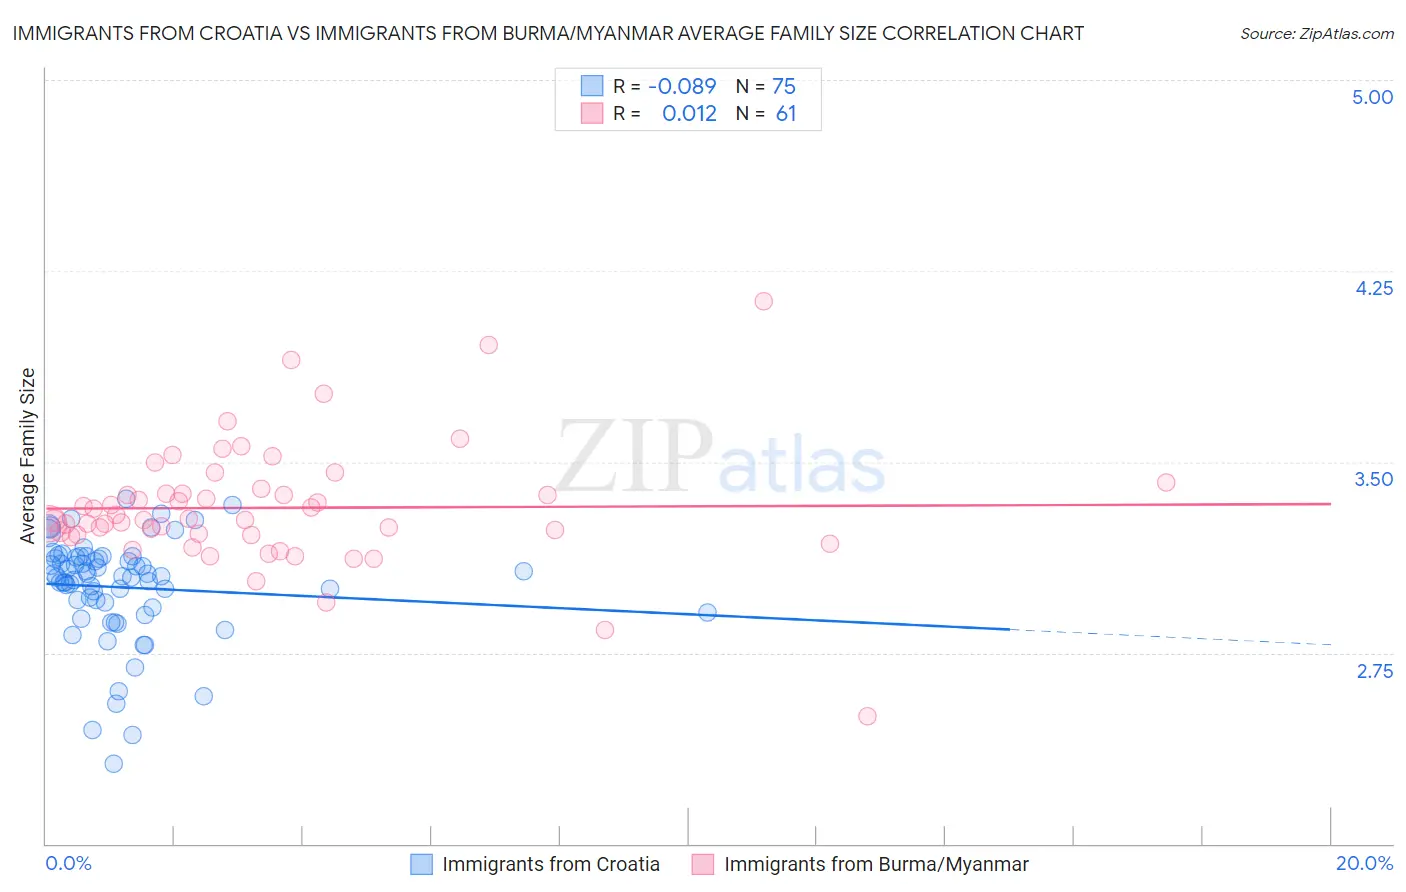
Immigrants from Croatia vs Immigrants from Burma/Myanmar Average Family Size Correlation Chart
The statistical analysis conducted on geographies consisting of 132,563,359 people shows a slight negative correlation between the proportion of Immigrants from Croatia and average family size in the United States with a correlation coefficient (R) of -0.089 and weighted average of 3.14. Similarly, the statistical analysis conducted on geographies consisting of 172,260,665 people shows no correlation between the proportion of Immigrants from Burma/Myanmar and average family size in the United States with a correlation coefficient (R) of 0.012 and weighted average of 3.29, a difference of 4.8%.
Average Family Size Correlation Summary
| Measurement | Immigrants from Croatia | Immigrants from Burma/Myanmar |
| Minimum | 2.32 | 2.50 |
| Maximum | 3.36 | 4.13 |
| Range | 1.04 | 1.63 |
| Mean | 3.01 | 3.32 |
| Median | 3.05 | 3.27 |
| Interquartile 25% (IQ1) | 2.93 | 3.21 |
| Interquartile 75% (IQ3) | 3.13 | 3.39 |
| Interquartile Range (IQR) | 0.20 | 0.17 |
| Standard Deviation (Sample) | 0.20 | 0.25 |
| Standard Deviation (Population) | 0.20 | 0.24 |
Similar Demographics by Average Family Size
Demographics Similar to Immigrants from Croatia by Average Family Size
In terms of average family size, the demographic groups most similar to Immigrants from Croatia are Austrian (3.14, a difference of 0.010%), Ukrainian (3.14, a difference of 0.010%), Immigrants from Western Europe (3.14, a difference of 0.010%), Colville (3.14, a difference of 0.010%), and Scandinavian (3.14, a difference of 0.020%).
| Demographics | Rating | Rank | Average Family Size |
| Greeks | 0.3 /100 | #287 | Tragic 3.14 |
| Immigrants | Czechoslovakia | 0.3 /100 | #288 | Tragic 3.14 |
| Immigrants | Norway | 0.3 /100 | #289 | Tragic 3.14 |
| Cypriots | 0.3 /100 | #290 | Tragic 3.14 |
| Alsatians | 0.2 /100 | #291 | Tragic 3.14 |
| Europeans | 0.2 /100 | #292 | Tragic 3.14 |
| Scandinavians | 0.2 /100 | #293 | Tragic 3.14 |
| Immigrants | Croatia | 0.2 /100 | #294 | Tragic 3.14 |
| Austrians | 0.2 /100 | #295 | Tragic 3.14 |
| Ukrainians | 0.2 /100 | #296 | Tragic 3.14 |
| Immigrants | Western Europe | 0.2 /100 | #297 | Tragic 3.14 |
| Colville | 0.2 /100 | #298 | Tragic 3.14 |
| Canadians | 0.2 /100 | #299 | Tragic 3.14 |
| Immigrants | Sweden | 0.2 /100 | #300 | Tragic 3.14 |
| Macedonians | 0.2 /100 | #301 | Tragic 3.13 |
Demographics Similar to Immigrants from Burma/Myanmar by Average Family Size
In terms of average family size, the demographic groups most similar to Immigrants from Burma/Myanmar are West Indian (3.29, a difference of 0.010%), Nigerian (3.29, a difference of 0.020%), Guamanian/Chamorro (3.29, a difference of 0.020%), Immigrants from Oceania (3.29, a difference of 0.030%), and Barbadian (3.29, a difference of 0.030%).
| Demographics | Rating | Rank | Average Family Size |
| Sierra Leoneans | 99.0 /100 | #94 | Exceptional 3.30 |
| Immigrants | Lebanon | 99.0 /100 | #95 | Exceptional 3.30 |
| U.S. Virgin Islanders | 98.8 /100 | #96 | Exceptional 3.29 |
| Immigrants | Oceania | 98.7 /100 | #97 | Exceptional 3.29 |
| Barbadians | 98.6 /100 | #98 | Exceptional 3.29 |
| Nigerians | 98.6 /100 | #99 | Exceptional 3.29 |
| Guamanians/Chamorros | 98.6 /100 | #100 | Exceptional 3.29 |
| Immigrants | Burma/Myanmar | 98.6 /100 | #101 | Exceptional 3.29 |
| West Indians | 98.5 /100 | #102 | Exceptional 3.29 |
| Immigrants | Western Africa | 98.4 /100 | #103 | Exceptional 3.29 |
| Bolivians | 98.3 /100 | #104 | Exceptional 3.29 |
| Immigrants | Ghana | 98.1 /100 | #105 | Exceptional 3.29 |
| Paiute | 98.0 /100 | #106 | Exceptional 3.29 |
| Ghanaians | 98.0 /100 | #107 | Exceptional 3.29 |
| Asians | 97.0 /100 | #108 | Exceptional 3.28 |