Somali vs Immigrants from Russia Currently Married
COMPARE
Somali
Immigrants from Russia
Currently Married
Currently Married Comparison
Somalis
Immigrants from Russia
41.5%
CURRENTLY MARRIED
0.0/ 100
METRIC RATING
312th/ 347
METRIC RANK
47.7%
CURRENTLY MARRIED
92.0/ 100
METRIC RATING
110th/ 347
METRIC RANK
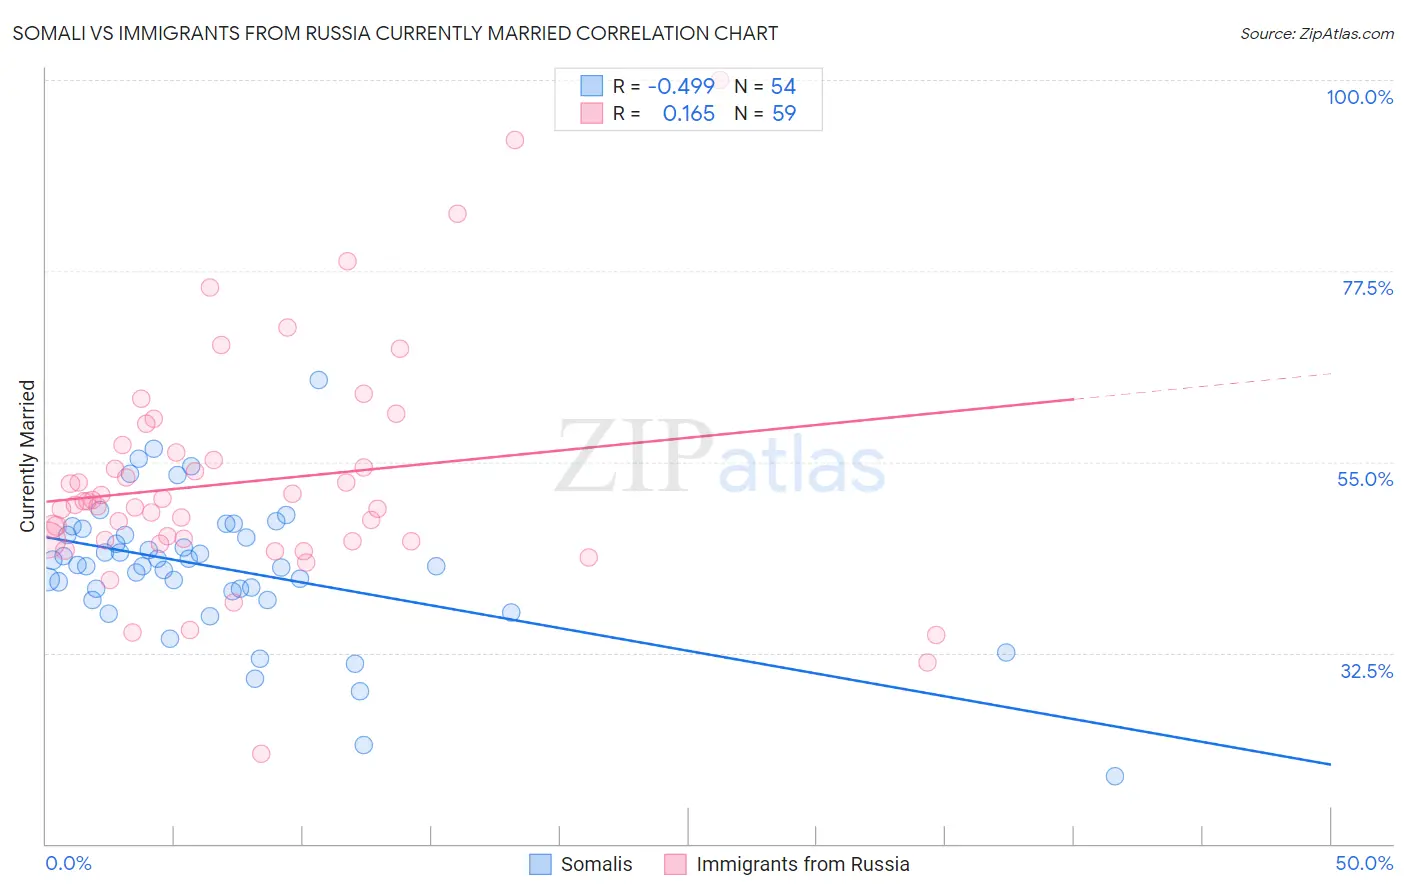
Somali vs Immigrants from Russia Currently Married Correlation Chart
The statistical analysis conducted on geographies consisting of 99,327,030 people shows a moderate negative correlation between the proportion of Somalis and percentage of population currently married in the United States with a correlation coefficient (R) of -0.499 and weighted average of 41.5%. Similarly, the statistical analysis conducted on geographies consisting of 347,902,051 people shows a poor positive correlation between the proportion of Immigrants from Russia and percentage of population currently married in the United States with a correlation coefficient (R) of 0.165 and weighted average of 47.7%, a difference of 14.9%.
Currently Married Correlation Summary
| Measurement | Somali | Immigrants from Russia |
| Minimum | 18.0% | 20.6% |
| Maximum | 64.7% | 100.0% |
| Range | 46.7% | 79.4% |
| Mean | 42.5% | 52.6% |
| Median | 42.8% | 49.9% |
| Interquartile 25% (IQ1) | 39.7% | 45.6% |
| Interquartile 75% (IQ3) | 46.5% | 56.2% |
| Interquartile Range (IQR) | 6.8% | 10.6% |
| Standard Deviation (Sample) | 8.1% | 13.7% |
| Standard Deviation (Population) | 8.1% | 13.6% |
Similar Demographics by Currently Married
Demographics Similar to Somalis by Currently Married
In terms of currently married, the demographic groups most similar to Somalis are Trinidadian and Tobagonian (41.5%, a difference of 0.18%), Jamaican (41.4%, a difference of 0.29%), Guyanese (41.6%, a difference of 0.33%), West Indian (41.3%, a difference of 0.36%), and Inupiat (41.3%, a difference of 0.45%).
| Demographics | Rating | Rank | Currently Married |
| Immigrants | Trinidad and Tobago | 0.0 /100 | #305 | Tragic 41.9% |
| Immigrants | Guyana | 0.0 /100 | #306 | Tragic 41.9% |
| Africans | 0.0 /100 | #307 | Tragic 41.8% |
| Immigrants | Belize | 0.0 /100 | #308 | Tragic 41.8% |
| Immigrants | Liberia | 0.0 /100 | #309 | Tragic 41.8% |
| Guyanese | 0.0 /100 | #310 | Tragic 41.6% |
| Trinidadians and Tobagonians | 0.0 /100 | #311 | Tragic 41.5% |
| Somalis | 0.0 /100 | #312 | Tragic 41.5% |
| Jamaicans | 0.0 /100 | #313 | Tragic 41.4% |
| West Indians | 0.0 /100 | #314 | Tragic 41.3% |
| Inupiat | 0.0 /100 | #315 | Tragic 41.3% |
| Immigrants | Caribbean | 0.0 /100 | #316 | Tragic 41.3% |
| Haitians | 0.0 /100 | #317 | Tragic 41.3% |
| Bahamians | 0.0 /100 | #318 | Tragic 41.2% |
| Immigrants | Somalia | 0.0 /100 | #319 | Tragic 41.2% |
Demographics Similar to Immigrants from Russia by Currently Married
In terms of currently married, the demographic groups most similar to Immigrants from Russia are Immigrants from Egypt (47.7%, a difference of 0.040%), Tsimshian (47.7%, a difference of 0.050%), Immigrants from Hungary (47.6%, a difference of 0.090%), Immigrants from Western Europe (47.6%, a difference of 0.10%), and Immigrants from Italy (47.7%, a difference of 0.11%).
| Demographics | Rating | Rank | Currently Married |
| Cypriots | 93.7 /100 | #103 | Exceptional 47.8% |
| Serbians | 93.6 /100 | #104 | Exceptional 47.8% |
| Immigrants | Singapore | 93.3 /100 | #105 | Exceptional 47.8% |
| Immigrants | Greece | 93.1 /100 | #106 | Exceptional 47.7% |
| Immigrants | Italy | 92.9 /100 | #107 | Exceptional 47.7% |
| Tsimshian | 92.4 /100 | #108 | Exceptional 47.7% |
| Immigrants | Egypt | 92.3 /100 | #109 | Exceptional 47.7% |
| Immigrants | Russia | 92.0 /100 | #110 | Exceptional 47.7% |
| Immigrants | Hungary | 91.2 /100 | #111 | Exceptional 47.6% |
| Immigrants | Western Europe | 91.1 /100 | #112 | Exceptional 47.6% |
| Immigrants | Denmark | 90.9 /100 | #113 | Exceptional 47.6% |
| South Africans | 90.5 /100 | #114 | Exceptional 47.6% |
| Immigrants | Indonesia | 90.5 /100 | #115 | Exceptional 47.6% |
| Palestinians | 90.4 /100 | #116 | Exceptional 47.6% |
| Puget Sound Salish | 90.3 /100 | #117 | Exceptional 47.6% |