Somali vs Immigrants from Middle Africa Currently Married
COMPARE
Somali
Immigrants from Middle Africa
Currently Married
Currently Married Comparison
Somalis
Immigrants from Middle Africa
41.5%
CURRENTLY MARRIED
0.0/ 100
METRIC RATING
312th/ 347
METRIC RANK
43.0%
CURRENTLY MARRIED
0.0/ 100
METRIC RATING
285th/ 347
METRIC RANK
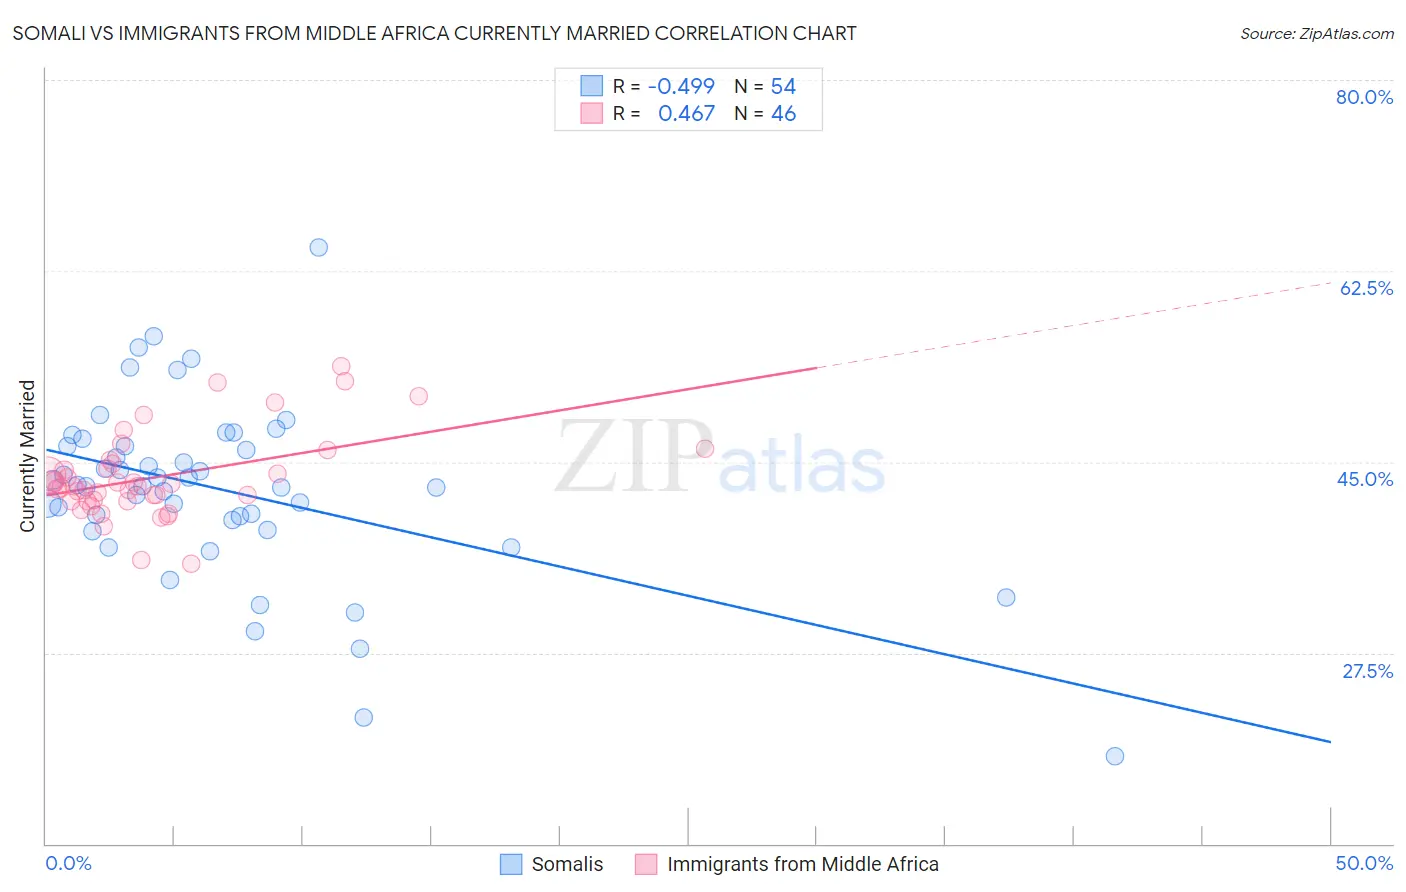
Somali vs Immigrants from Middle Africa Currently Married Correlation Chart
The statistical analysis conducted on geographies consisting of 99,327,030 people shows a moderate negative correlation between the proportion of Somalis and percentage of population currently married in the United States with a correlation coefficient (R) of -0.499 and weighted average of 41.5%. Similarly, the statistical analysis conducted on geographies consisting of 202,724,037 people shows a moderate positive correlation between the proportion of Immigrants from Middle Africa and percentage of population currently married in the United States with a correlation coefficient (R) of 0.467 and weighted average of 43.0%, a difference of 3.6%.
Currently Married Correlation Summary
| Measurement | Somali | Immigrants from Middle Africa |
| Minimum | 18.0% | 35.6% |
| Maximum | 64.7% | 53.8% |
| Range | 46.7% | 18.2% |
| Mean | 42.5% | 43.6% |
| Median | 42.8% | 42.8% |
| Interquartile 25% (IQ1) | 39.7% | 41.4% |
| Interquartile 75% (IQ3) | 46.5% | 44.8% |
| Interquartile Range (IQR) | 6.8% | 3.4% |
| Standard Deviation (Sample) | 8.1% | 3.9% |
| Standard Deviation (Population) | 8.1% | 3.8% |
Similar Demographics by Currently Married
Demographics Similar to Somalis by Currently Married
In terms of currently married, the demographic groups most similar to Somalis are Trinidadian and Tobagonian (41.5%, a difference of 0.18%), Jamaican (41.4%, a difference of 0.29%), Guyanese (41.6%, a difference of 0.33%), West Indian (41.3%, a difference of 0.36%), and Inupiat (41.3%, a difference of 0.45%).
| Demographics | Rating | Rank | Currently Married |
| Immigrants | Trinidad and Tobago | 0.0 /100 | #305 | Tragic 41.9% |
| Immigrants | Guyana | 0.0 /100 | #306 | Tragic 41.9% |
| Africans | 0.0 /100 | #307 | Tragic 41.8% |
| Immigrants | Belize | 0.0 /100 | #308 | Tragic 41.8% |
| Immigrants | Liberia | 0.0 /100 | #309 | Tragic 41.8% |
| Guyanese | 0.0 /100 | #310 | Tragic 41.6% |
| Trinidadians and Tobagonians | 0.0 /100 | #311 | Tragic 41.5% |
| Somalis | 0.0 /100 | #312 | Tragic 41.5% |
| Jamaicans | 0.0 /100 | #313 | Tragic 41.4% |
| West Indians | 0.0 /100 | #314 | Tragic 41.3% |
| Inupiat | 0.0 /100 | #315 | Tragic 41.3% |
| Immigrants | Caribbean | 0.0 /100 | #316 | Tragic 41.3% |
| Haitians | 0.0 /100 | #317 | Tragic 41.3% |
| Bahamians | 0.0 /100 | #318 | Tragic 41.2% |
| Immigrants | Somalia | 0.0 /100 | #319 | Tragic 41.2% |
Demographics Similar to Immigrants from Middle Africa by Currently Married
In terms of currently married, the demographic groups most similar to Immigrants from Middle Africa are Ghanaian (42.9%, a difference of 0.13%), Guatemalan (42.9%, a difference of 0.15%), Kiowa (43.2%, a difference of 0.40%), Immigrants from El Salvador (43.1%, a difference of 0.40%), and Native/Alaskan (42.8%, a difference of 0.42%).
| Demographics | Rating | Rank | Currently Married |
| Central Americans | 0.0 /100 | #278 | Tragic 43.3% |
| Central American Indians | 0.0 /100 | #279 | Tragic 43.3% |
| Apache | 0.0 /100 | #280 | Tragic 43.2% |
| Chippewa | 0.0 /100 | #281 | Tragic 43.2% |
| Immigrants | Ecuador | 0.0 /100 | #282 | Tragic 43.2% |
| Kiowa | 0.0 /100 | #283 | Tragic 43.2% |
| Immigrants | El Salvador | 0.0 /100 | #284 | Tragic 43.1% |
| Immigrants | Middle Africa | 0.0 /100 | #285 | Tragic 43.0% |
| Ghanaians | 0.0 /100 | #286 | Tragic 42.9% |
| Guatemalans | 0.0 /100 | #287 | Tragic 42.9% |
| Natives/Alaskans | 0.0 /100 | #288 | Tragic 42.8% |
| Paiute | 0.0 /100 | #289 | Tragic 42.7% |
| Immigrants | Ghana | 0.0 /100 | #290 | Tragic 42.7% |
| Immigrants | Guatemala | 0.0 /100 | #291 | Tragic 42.6% |
| Sub-Saharan Africans | 0.0 /100 | #292 | Tragic 42.6% |