Korean vs Indonesian Births to Unmarried Women
COMPARE
Korean
Indonesian
Births to Unmarried Women
Births to Unmarried Women Comparison
Koreans
Indonesians
30.1%
BIRTHS TO UNMARRIED WOMEN
88.9/ 100
METRIC RATING
121st/ 347
METRIC RANK
35.0%
BIRTHS TO UNMARRIED WOMEN
1.2/ 100
METRIC RATING
242nd/ 347
METRIC RANK
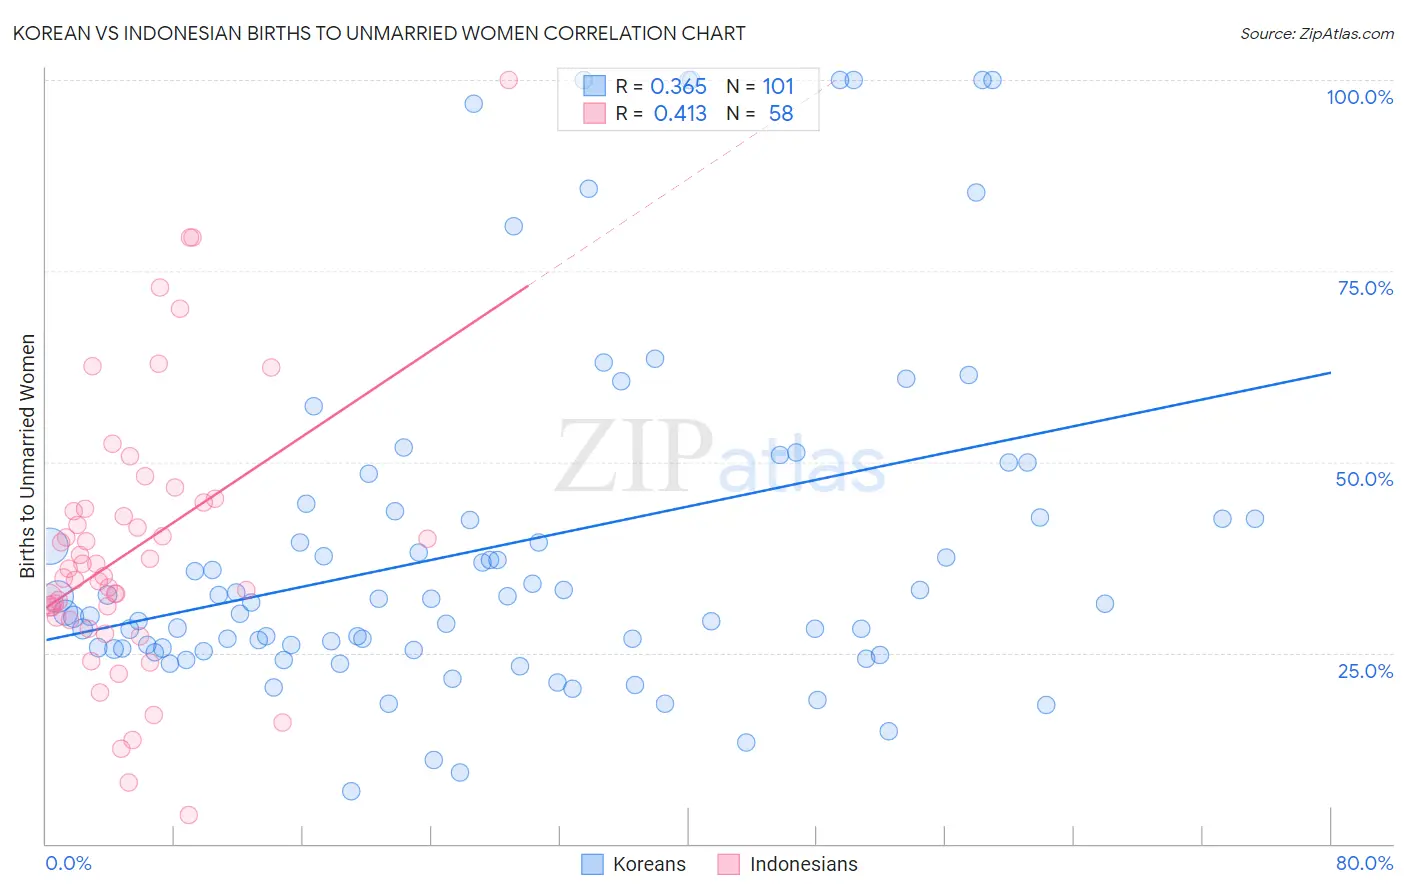
Korean vs Indonesian Births to Unmarried Women Correlation Chart
The statistical analysis conducted on geographies consisting of 466,988,654 people shows a mild positive correlation between the proportion of Koreans and percentage of births to unmarried women in the United States with a correlation coefficient (R) of 0.365 and weighted average of 30.1%. Similarly, the statistical analysis conducted on geographies consisting of 158,009,570 people shows a moderate positive correlation between the proportion of Indonesians and percentage of births to unmarried women in the United States with a correlation coefficient (R) of 0.413 and weighted average of 35.0%, a difference of 16.2%.
Births to Unmarried Women Correlation Summary
| Measurement | Korean | Indonesian |
| Minimum | 6.8% | 3.8% |
| Maximum | 100.0% | 100.0% |
| Range | 93.2% | 96.2% |
| Mean | 39.1% | 38.6% |
| Median | 31.5% | 35.5% |
| Interquartile 25% (IQ1) | 25.5% | 29.6% |
| Interquartile 75% (IQ3) | 43.1% | 43.8% |
| Interquartile Range (IQR) | 17.6% | 14.2% |
| Standard Deviation (Sample) | 22.9% | 17.8% |
| Standard Deviation (Population) | 22.8% | 17.7% |
Similar Demographics by Births to Unmarried Women
Demographics Similar to Koreans by Births to Unmarried Women
In terms of births to unmarried women, the demographic groups most similar to Koreans are Immigrants from Argentina (30.1%, a difference of 0.050%), Ugandan (30.1%, a difference of 0.070%), Syrian (30.2%, a difference of 0.18%), Croatian (30.2%, a difference of 0.21%), and Vietnamese (30.2%, a difference of 0.28%).
| Demographics | Rating | Rank | Births to Unmarried Women |
| Immigrants | Croatia | 92.6 /100 | #114 | Exceptional 29.8% |
| Ethiopians | 91.9 /100 | #115 | Exceptional 29.8% |
| Immigrants | Italy | 91.7 /100 | #116 | Exceptional 29.9% |
| Immigrants | Netherlands | 91.1 /100 | #117 | Exceptional 29.9% |
| Immigrants | Norway | 91.0 /100 | #118 | Exceptional 29.9% |
| Argentineans | 90.5 /100 | #119 | Exceptional 30.0% |
| Ugandans | 89.2 /100 | #120 | Excellent 30.1% |
| Koreans | 88.9 /100 | #121 | Excellent 30.1% |
| Immigrants | Argentina | 88.7 /100 | #122 | Excellent 30.1% |
| Syrians | 88.2 /100 | #123 | Excellent 30.2% |
| Croatians | 88.0 /100 | #124 | Excellent 30.2% |
| Vietnamese | 87.7 /100 | #125 | Excellent 30.2% |
| Europeans | 87.2 /100 | #126 | Excellent 30.2% |
| Chinese | 87.1 /100 | #127 | Excellent 30.2% |
| Icelanders | 86.0 /100 | #128 | Excellent 30.3% |
Demographics Similar to Indonesians by Births to Unmarried Women
In terms of births to unmarried women, the demographic groups most similar to Indonesians are Immigrants from Guyana (35.0%, a difference of 0.10%), Immigrants from Middle Africa (34.9%, a difference of 0.13%), Sierra Leonean (34.9%, a difference of 0.38%), Japanese (35.2%, a difference of 0.49%), and Guyanese (35.2%, a difference of 0.55%).
| Demographics | Rating | Rank | Births to Unmarried Women |
| Immigrants | Ghana | 2.2 /100 | #235 | Tragic 34.5% |
| Immigrants | Cameroon | 1.6 /100 | #236 | Tragic 34.7% |
| Marshallese | 1.6 /100 | #237 | Tragic 34.8% |
| Immigrants | Cambodia | 1.6 /100 | #238 | Tragic 34.8% |
| Sierra Leoneans | 1.4 /100 | #239 | Tragic 34.9% |
| Immigrants | Middle Africa | 1.2 /100 | #240 | Tragic 34.9% |
| Immigrants | Guyana | 1.2 /100 | #241 | Tragic 35.0% |
| Indonesians | 1.2 /100 | #242 | Tragic 35.0% |
| Japanese | 0.9 /100 | #243 | Tragic 35.2% |
| Guyanese | 0.9 /100 | #244 | Tragic 35.2% |
| Shoshone | 0.8 /100 | #245 | Tragic 35.3% |
| Nigerians | 0.7 /100 | #246 | Tragic 35.3% |
| Immigrants | Nigeria | 0.7 /100 | #247 | Tragic 35.4% |
| Immigrants | Nonimmigrants | 0.6 /100 | #248 | Tragic 35.5% |
| Bermudans | 0.6 /100 | #249 | Tragic 35.5% |