Scotch-Irish vs Indonesian Child Poverty Among Boys Under 16
COMPARE
Scotch-Irish
Indonesian
Child Poverty Among Boys Under 16
Child Poverty Among Boys Under 16 Comparison
Scotch-Irish
Indonesians
16.5%
CHILD POVERTY AMONG BOYS UNDER 16
47.5/ 100
METRIC RATING
178th/ 347
METRIC RANK
20.8%
CHILD POVERTY AMONG BOYS UNDER 16
0.0/ 100
METRIC RATING
296th/ 347
METRIC RANK
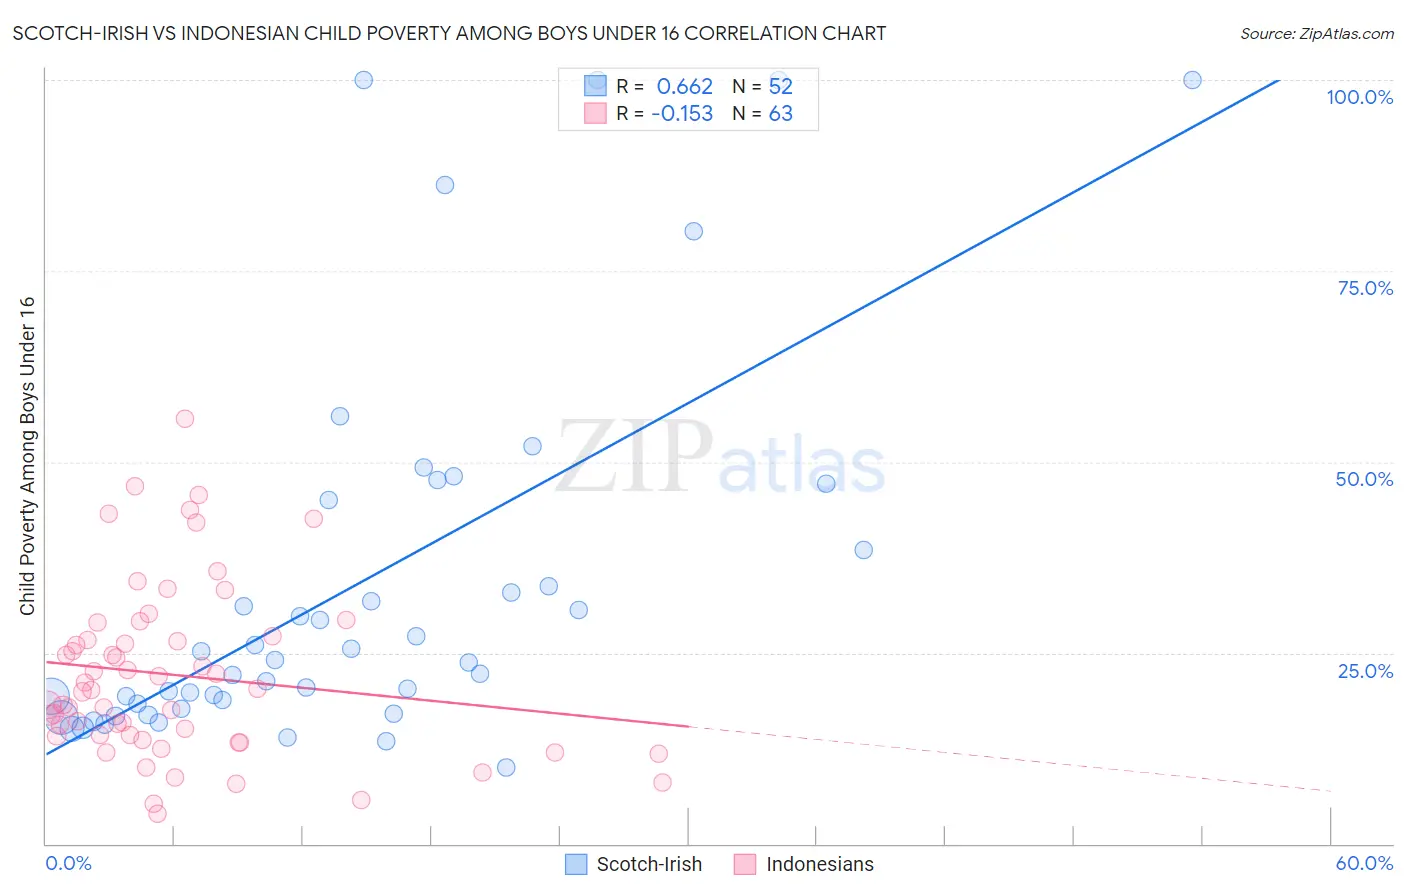
Scotch-Irish vs Indonesian Child Poverty Among Boys Under 16 Correlation Chart
The statistical analysis conducted on geographies consisting of 530,822,758 people shows a significant positive correlation between the proportion of Scotch-Irish and poverty level among boys under the age of 16 in the United States with a correlation coefficient (R) of 0.662 and weighted average of 16.5%. Similarly, the statistical analysis conducted on geographies consisting of 161,767,910 people shows a poor negative correlation between the proportion of Indonesians and poverty level among boys under the age of 16 in the United States with a correlation coefficient (R) of -0.153 and weighted average of 20.8%, a difference of 26.1%.
Child Poverty Among Boys Under 16 Correlation Summary
| Measurement | Scotch-Irish | Indonesian |
| Minimum | 10.0% | 3.9% |
| Maximum | 100.0% | 55.6% |
| Range | 90.0% | 51.7% |
| Mean | 33.9% | 22.1% |
| Median | 23.9% | 20.1% |
| Interquartile 25% (IQ1) | 18.0% | 14.1% |
| Interquartile 75% (IQ3) | 41.8% | 27.1% |
| Interquartile Range (IQR) | 23.8% | 13.0% |
| Standard Deviation (Sample) | 24.8% | 11.3% |
| Standard Deviation (Population) | 24.6% | 11.2% |
Similar Demographics by Child Poverty Among Boys Under 16
Demographics Similar to Scotch-Irish by Child Poverty Among Boys Under 16
In terms of child poverty among boys under 16, the demographic groups most similar to Scotch-Irish are Hungarian (16.5%, a difference of 0.020%), Ethiopian (16.5%, a difference of 0.040%), White/Caucasian (16.5%, a difference of 0.080%), Immigrants from Syria (16.5%, a difference of 0.17%), and Hawaiian (16.5%, a difference of 0.22%).
| Demographics | Rating | Rank | Child Poverty Among Boys Under 16 |
| Immigrants | Ethiopia | 51.3 /100 | #171 | Average 16.4% |
| Immigrants | Colombia | 50.8 /100 | #172 | Average 16.4% |
| Tsimshian | 50.5 /100 | #173 | Average 16.4% |
| Uruguayans | 50.0 /100 | #174 | Average 16.4% |
| Immigrants | Syria | 49.0 /100 | #175 | Average 16.5% |
| Whites/Caucasians | 48.2 /100 | #176 | Average 16.5% |
| Ethiopians | 47.8 /100 | #177 | Average 16.5% |
| Scotch-Irish | 47.5 /100 | #178 | Average 16.5% |
| Hungarians | 47.3 /100 | #179 | Average 16.5% |
| Hawaiians | 45.5 /100 | #180 | Average 16.5% |
| South American Indians | 44.3 /100 | #181 | Average 16.5% |
| Lebanese | 43.3 /100 | #182 | Average 16.6% |
| Kenyans | 41.0 /100 | #183 | Average 16.6% |
| Celtics | 40.6 /100 | #184 | Average 16.6% |
| Immigrants | Western Asia | 40.4 /100 | #185 | Average 16.6% |
Demographics Similar to Indonesians by Child Poverty Among Boys Under 16
In terms of child poverty among boys under 16, the demographic groups most similar to Indonesians are Mexican (20.7%, a difference of 0.20%), Immigrants from Bahamas (20.7%, a difference of 0.32%), Immigrants from Senegal (20.7%, a difference of 0.44%), Yaqui (20.7%, a difference of 0.45%), and Hispanic or Latino (20.9%, a difference of 0.61%).
| Demographics | Rating | Rank | Child Poverty Among Boys Under 16 |
| Blackfeet | 0.0 /100 | #289 | Tragic 20.4% |
| Senegalese | 0.0 /100 | #290 | Tragic 20.6% |
| Immigrants | Latin America | 0.0 /100 | #291 | Tragic 20.6% |
| Yaqui | 0.0 /100 | #292 | Tragic 20.7% |
| Immigrants | Senegal | 0.0 /100 | #293 | Tragic 20.7% |
| Immigrants | Bahamas | 0.0 /100 | #294 | Tragic 20.7% |
| Mexicans | 0.0 /100 | #295 | Tragic 20.7% |
| Indonesians | 0.0 /100 | #296 | Tragic 20.8% |
| Hispanics or Latinos | 0.0 /100 | #297 | Tragic 20.9% |
| Chippewa | 0.0 /100 | #298 | Tragic 21.0% |
| Immigrants | Caribbean | 0.0 /100 | #299 | Tragic 21.0% |
| Haitians | 0.0 /100 | #300 | Tragic 21.0% |
| Guatemalans | 0.0 /100 | #301 | Tragic 21.1% |
| Somalis | 0.0 /100 | #302 | Tragic 21.1% |
| Immigrants | Haiti | 0.0 /100 | #303 | Tragic 21.3% |