Immigrants from Egypt vs Indonesian Births to Unmarried Women
COMPARE
Immigrants from Egypt
Indonesian
Births to Unmarried Women
Births to Unmarried Women Comparison
Immigrants from Egypt
Indonesians
28.4%
BIRTHS TO UNMARRIED WOMEN
98.8/ 100
METRIC RATING
66th/ 347
METRIC RANK
35.0%
BIRTHS TO UNMARRIED WOMEN
1.2/ 100
METRIC RATING
242nd/ 347
METRIC RANK
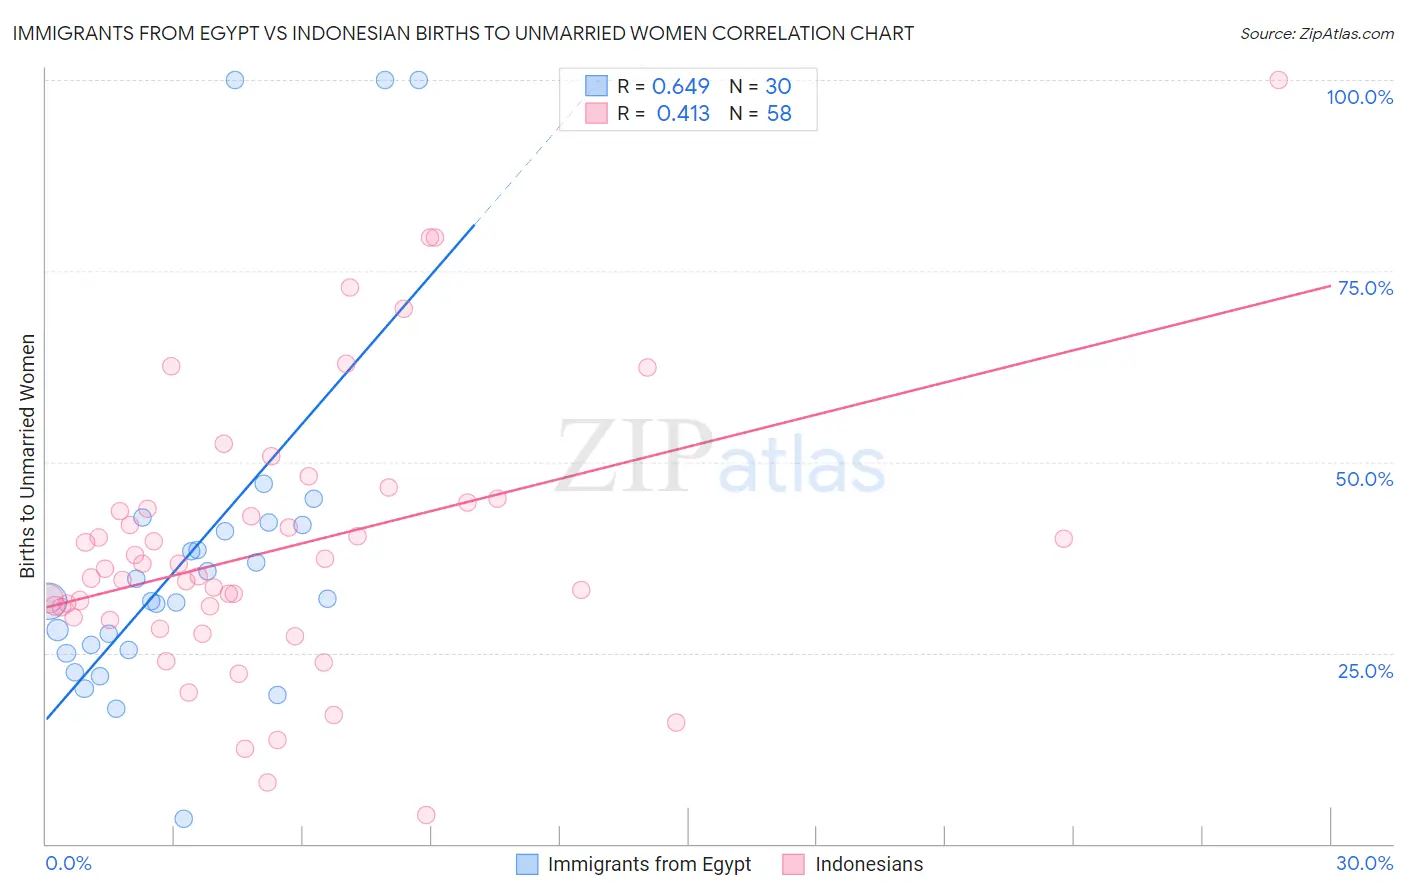
Immigrants from Egypt vs Indonesian Births to Unmarried Women Correlation Chart
The statistical analysis conducted on geographies consisting of 233,073,751 people shows a significant positive correlation between the proportion of Immigrants from Egypt and percentage of births to unmarried women in the United States with a correlation coefficient (R) of 0.649 and weighted average of 28.4%. Similarly, the statistical analysis conducted on geographies consisting of 158,009,570 people shows a moderate positive correlation between the proportion of Indonesians and percentage of births to unmarried women in the United States with a correlation coefficient (R) of 0.413 and weighted average of 35.0%, a difference of 23.2%.
Births to Unmarried Women Correlation Summary
| Measurement | Immigrants from Egypt | Indonesian |
| Minimum | 3.2% | 3.8% |
| Maximum | 100.0% | 100.0% |
| Range | 96.8% | 96.2% |
| Mean | 38.0% | 38.6% |
| Median | 31.9% | 35.5% |
| Interquartile 25% (IQ1) | 25.4% | 29.6% |
| Interquartile 75% (IQ3) | 41.7% | 43.8% |
| Interquartile Range (IQR) | 16.3% | 14.2% |
| Standard Deviation (Sample) | 23.1% | 17.8% |
| Standard Deviation (Population) | 22.7% | 17.7% |
Similar Demographics by Births to Unmarried Women
Demographics Similar to Immigrants from Egypt by Births to Unmarried Women
In terms of births to unmarried women, the demographic groups most similar to Immigrants from Egypt are Immigrants from Czechoslovakia (28.4%, a difference of 0.020%), Tongan (28.4%, a difference of 0.040%), Palestinian (28.4%, a difference of 0.11%), Immigrants from Europe (28.4%, a difference of 0.16%), and Bolivian (28.5%, a difference of 0.20%).
| Demographics | Rating | Rank | Births to Unmarried Women |
| Immigrants | Kazakhstan | 99.1 /100 | #59 | Exceptional 28.1% |
| Immigrants | Turkey | 99.1 /100 | #60 | Exceptional 28.1% |
| Immigrants | North Macedonia | 99.1 /100 | #61 | Exceptional 28.1% |
| Egyptians | 99.0 /100 | #62 | Exceptional 28.2% |
| Immigrants | Serbia | 98.9 /100 | #63 | Exceptional 28.3% |
| Tongans | 98.8 /100 | #64 | Exceptional 28.4% |
| Immigrants | Czechoslovakia | 98.8 /100 | #65 | Exceptional 28.4% |
| Immigrants | Egypt | 98.8 /100 | #66 | Exceptional 28.4% |
| Palestinians | 98.7 /100 | #67 | Exceptional 28.4% |
| Immigrants | Europe | 98.7 /100 | #68 | Exceptional 28.4% |
| Bolivians | 98.7 /100 | #69 | Exceptional 28.5% |
| Laotians | 98.6 /100 | #70 | Exceptional 28.5% |
| Jordanians | 98.5 /100 | #71 | Exceptional 28.5% |
| Immigrants | Sweden | 98.5 /100 | #72 | Exceptional 28.5% |
| Albanians | 98.5 /100 | #73 | Exceptional 28.5% |
Demographics Similar to Indonesians by Births to Unmarried Women
In terms of births to unmarried women, the demographic groups most similar to Indonesians are Immigrants from Guyana (35.0%, a difference of 0.10%), Immigrants from Middle Africa (34.9%, a difference of 0.13%), Sierra Leonean (34.9%, a difference of 0.38%), Japanese (35.2%, a difference of 0.49%), and Guyanese (35.2%, a difference of 0.55%).
| Demographics | Rating | Rank | Births to Unmarried Women |
| Immigrants | Ghana | 2.2 /100 | #235 | Tragic 34.5% |
| Immigrants | Cameroon | 1.6 /100 | #236 | Tragic 34.7% |
| Marshallese | 1.6 /100 | #237 | Tragic 34.8% |
| Immigrants | Cambodia | 1.6 /100 | #238 | Tragic 34.8% |
| Sierra Leoneans | 1.4 /100 | #239 | Tragic 34.9% |
| Immigrants | Middle Africa | 1.2 /100 | #240 | Tragic 34.9% |
| Immigrants | Guyana | 1.2 /100 | #241 | Tragic 35.0% |
| Indonesians | 1.2 /100 | #242 | Tragic 35.0% |
| Japanese | 0.9 /100 | #243 | Tragic 35.2% |
| Guyanese | 0.9 /100 | #244 | Tragic 35.2% |
| Shoshone | 0.8 /100 | #245 | Tragic 35.3% |
| Nigerians | 0.7 /100 | #246 | Tragic 35.3% |
| Immigrants | Nigeria | 0.7 /100 | #247 | Tragic 35.4% |
| Immigrants | Nonimmigrants | 0.6 /100 | #248 | Tragic 35.5% |
| Bermudans | 0.6 /100 | #249 | Tragic 35.5% |