Immigrants from Europe vs Immigrants from Fiji Births to Unmarried Women
COMPARE
Immigrants from Europe
Immigrants from Fiji
Births to Unmarried Women
Births to Unmarried Women Comparison
Immigrants from Europe
Immigrants from Fiji
28.4%
BIRTHS TO UNMARRIED WOMEN
98.7/ 100
METRIC RATING
68th/ 347
METRIC RANK
29.2%
BIRTHS TO UNMARRIED WOMEN
96.6/ 100
METRIC RATING
91st/ 347
METRIC RANK
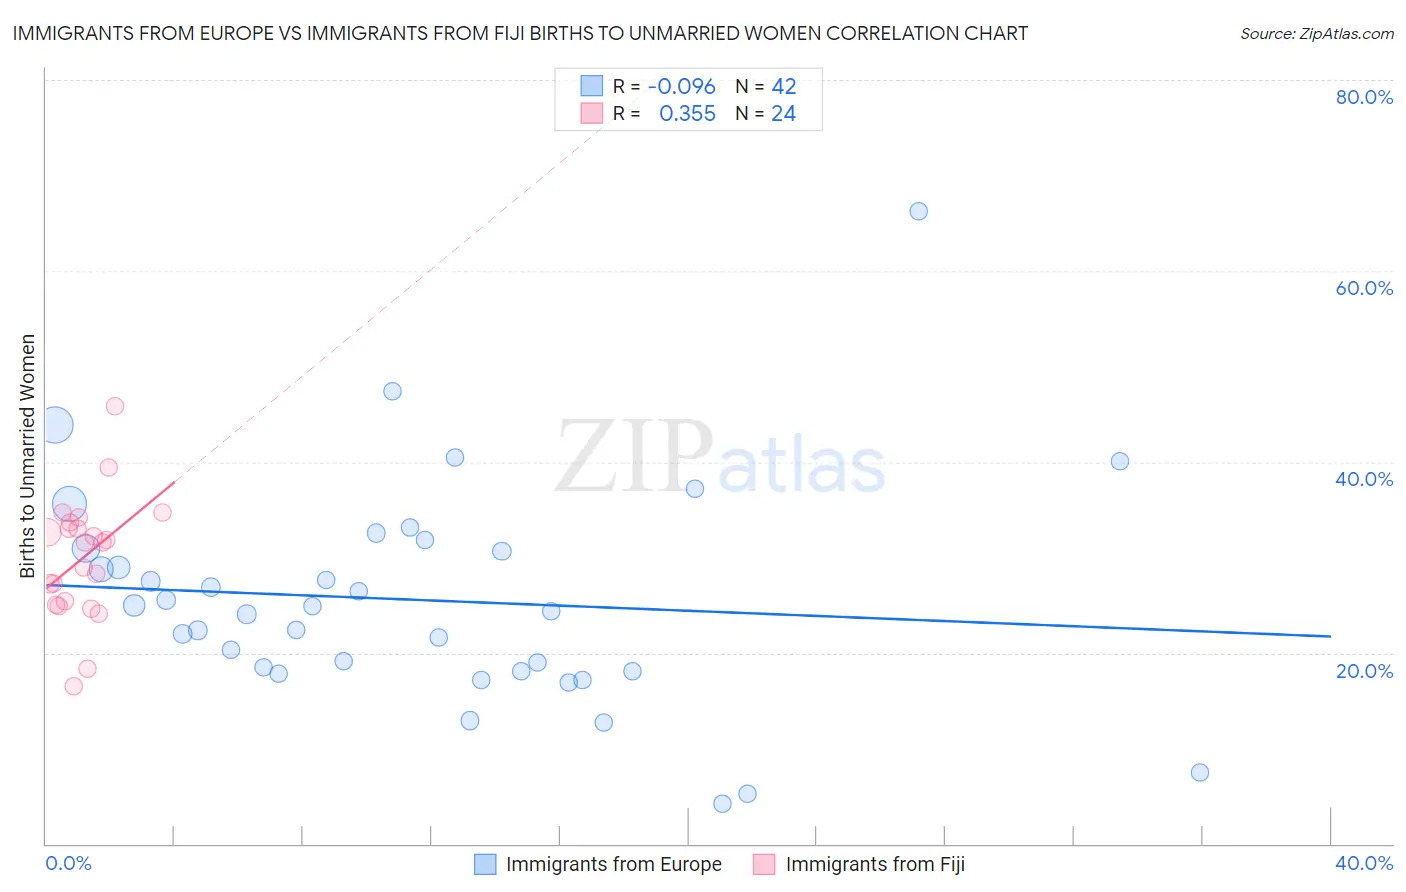
Immigrants from Europe vs Immigrants from Fiji Births to Unmarried Women Correlation Chart
The statistical analysis conducted on geographies consisting of 491,178,975 people shows a slight negative correlation between the proportion of Immigrants from Europe and percentage of births to unmarried women in the United States with a correlation coefficient (R) of -0.096 and weighted average of 28.4%. Similarly, the statistical analysis conducted on geographies consisting of 91,931,577 people shows a mild positive correlation between the proportion of Immigrants from Fiji and percentage of births to unmarried women in the United States with a correlation coefficient (R) of 0.355 and weighted average of 29.2%, a difference of 2.6%.
Births to Unmarried Women Correlation Summary
| Measurement | Immigrants from Europe | Immigrants from Fiji |
| Minimum | 4.2% | 16.5% |
| Maximum | 66.3% | 45.9% |
| Range | 62.1% | 29.3% |
| Mean | 25.5% | 30.0% |
| Median | 24.6% | 31.6% |
| Interquartile 25% (IQ1) | 18.1% | 25.2% |
| Interquartile 75% (IQ3) | 30.9% | 33.4% |
| Interquartile Range (IQR) | 12.8% | 8.1% |
| Standard Deviation (Sample) | 11.6% | 6.3% |
| Standard Deviation (Population) | 11.4% | 6.2% |
Similar Demographics by Births to Unmarried Women
Demographics Similar to Immigrants from Europe by Births to Unmarried Women
In terms of births to unmarried women, the demographic groups most similar to Immigrants from Europe are Bolivian (28.5%, a difference of 0.040%), Palestinian (28.4%, a difference of 0.050%), Laotian (28.5%, a difference of 0.10%), Immigrants from Egypt (28.4%, a difference of 0.16%), and Immigrants from Czechoslovakia (28.4%, a difference of 0.18%).
| Demographics | Rating | Rank | Births to Unmarried Women |
| Immigrants | North Macedonia | 99.1 /100 | #61 | Exceptional 28.1% |
| Egyptians | 99.0 /100 | #62 | Exceptional 28.2% |
| Immigrants | Serbia | 98.9 /100 | #63 | Exceptional 28.3% |
| Tongans | 98.8 /100 | #64 | Exceptional 28.4% |
| Immigrants | Czechoslovakia | 98.8 /100 | #65 | Exceptional 28.4% |
| Immigrants | Egypt | 98.8 /100 | #66 | Exceptional 28.4% |
| Palestinians | 98.7 /100 | #67 | Exceptional 28.4% |
| Immigrants | Europe | 98.7 /100 | #68 | Exceptional 28.4% |
| Bolivians | 98.7 /100 | #69 | Exceptional 28.5% |
| Laotians | 98.6 /100 | #70 | Exceptional 28.5% |
| Jordanians | 98.5 /100 | #71 | Exceptional 28.5% |
| Immigrants | Sweden | 98.5 /100 | #72 | Exceptional 28.5% |
| Albanians | 98.5 /100 | #73 | Exceptional 28.5% |
| Immigrants | Bolivia | 98.5 /100 | #74 | Exceptional 28.6% |
| Immigrants | Switzerland | 98.4 /100 | #75 | Exceptional 28.6% |
Demographics Similar to Immigrants from Fiji by Births to Unmarried Women
In terms of births to unmarried women, the demographic groups most similar to Immigrants from Fiji are Arab (29.2%, a difference of 0.040%), Estonian (29.2%, a difference of 0.080%), Ukrainian (29.2%, a difference of 0.20%), Immigrants from Latvia (29.1%, a difference of 0.21%), and Immigrants from Vietnam (29.3%, a difference of 0.34%).
| Demographics | Rating | Rank | Births to Unmarried Women |
| Immigrants | Poland | 97.6 /100 | #84 | Exceptional 28.9% |
| Sri Lankans | 97.5 /100 | #85 | Exceptional 28.9% |
| Immigrants | Jordan | 97.4 /100 | #86 | Exceptional 29.0% |
| Taiwanese | 97.3 /100 | #87 | Exceptional 29.0% |
| Immigrants | France | 97.3 /100 | #88 | Exceptional 29.0% |
| Immigrants | Saudi Arabia | 97.0 /100 | #89 | Exceptional 29.1% |
| Immigrants | Latvia | 96.8 /100 | #90 | Exceptional 29.1% |
| Immigrants | Fiji | 96.6 /100 | #91 | Exceptional 29.2% |
| Arabs | 96.5 /100 | #92 | Exceptional 29.2% |
| Estonians | 96.5 /100 | #93 | Exceptional 29.2% |
| Ukrainians | 96.3 /100 | #94 | Exceptional 29.2% |
| Immigrants | Vietnam | 96.1 /100 | #95 | Exceptional 29.3% |
| Norwegians | 95.8 /100 | #96 | Exceptional 29.3% |
| Immigrants | South Africa | 95.7 /100 | #97 | Exceptional 29.3% |
| Immigrants | Syria | 95.7 /100 | #98 | Exceptional 29.4% |