Arab vs Immigrants from Fiji Births to Unmarried Women
COMPARE
Arab
Immigrants from Fiji
Births to Unmarried Women
Births to Unmarried Women Comparison
Arabs
Immigrants from Fiji
29.2%
BIRTHS TO UNMARRIED WOMEN
96.5/ 100
METRIC RATING
92nd/ 347
METRIC RANK
29.2%
BIRTHS TO UNMARRIED WOMEN
96.6/ 100
METRIC RATING
91st/ 347
METRIC RANK
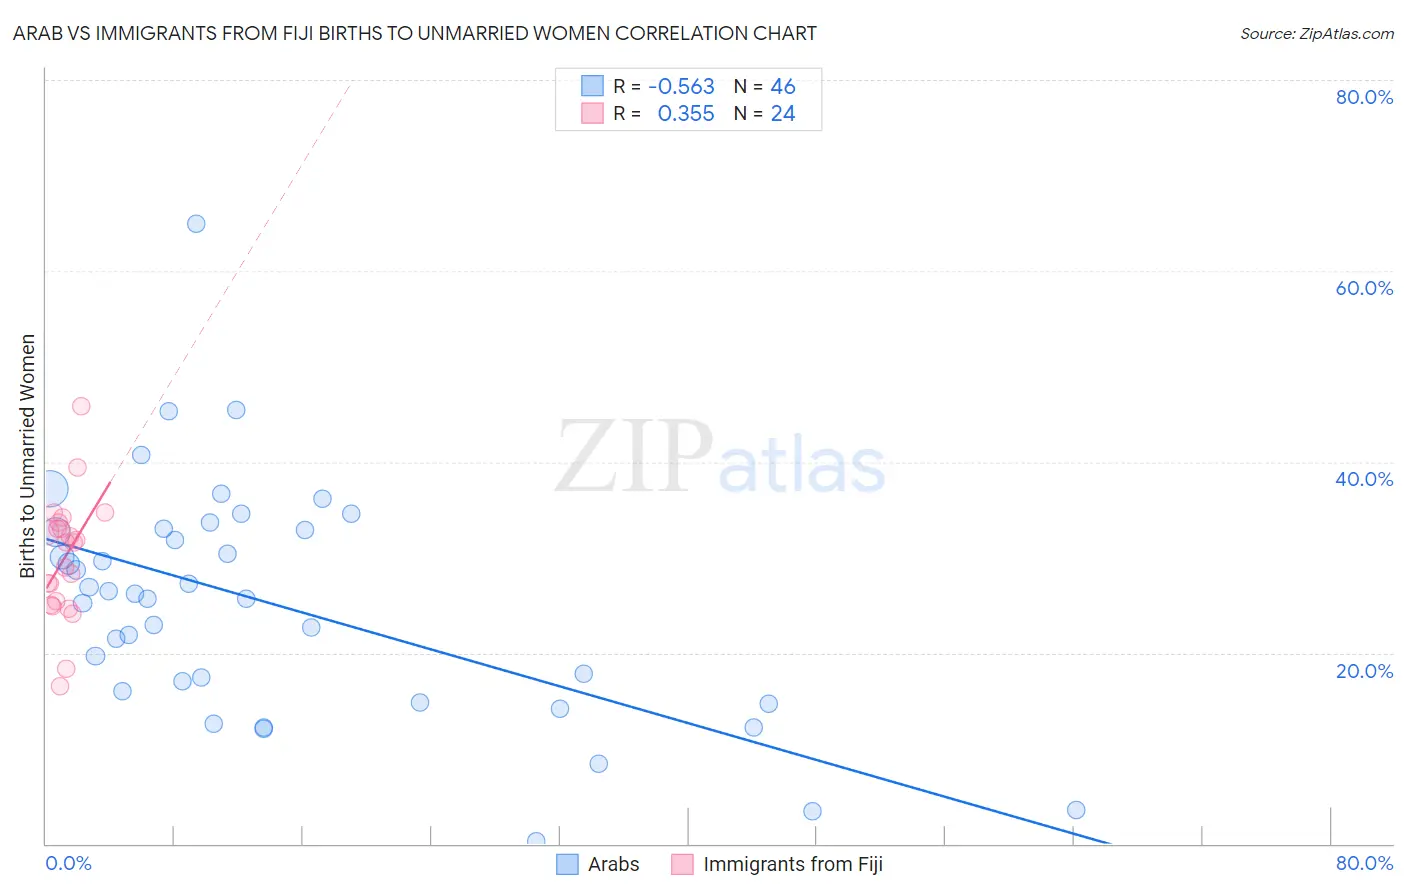
Arab vs Immigrants from Fiji Births to Unmarried Women Correlation Chart
The statistical analysis conducted on geographies consisting of 447,045,945 people shows a substantial negative correlation between the proportion of Arabs and percentage of births to unmarried women in the United States with a correlation coefficient (R) of -0.563 and weighted average of 29.2%. Similarly, the statistical analysis conducted on geographies consisting of 91,931,577 people shows a mild positive correlation between the proportion of Immigrants from Fiji and percentage of births to unmarried women in the United States with a correlation coefficient (R) of 0.355 and weighted average of 29.2%, a difference of 0.040%.
Births to Unmarried Women Correlation Summary
| Measurement | Arab | Immigrants from Fiji |
| Minimum | 0.20% | 16.5% |
| Maximum | 64.9% | 45.9% |
| Range | 64.7% | 29.3% |
| Mean | 25.1% | 30.0% |
| Median | 26.0% | 31.6% |
| Interquartile 25% (IQ1) | 16.0% | 25.2% |
| Interquartile 75% (IQ3) | 32.9% | 33.4% |
| Interquartile Range (IQR) | 16.9% | 8.1% |
| Standard Deviation (Sample) | 12.3% | 6.3% |
| Standard Deviation (Population) | 12.2% | 6.2% |
Demographics Similar to Arabs and Immigrants from Fiji by Births to Unmarried Women
In terms of births to unmarried women, the demographic groups most similar to Arabs are Estonian (29.2%, a difference of 0.040%), Ukrainian (29.2%, a difference of 0.16%), Immigrants from Latvia (29.1%, a difference of 0.25%), Immigrants from Vietnam (29.3%, a difference of 0.30%), and Immigrants from Saudi Arabia (29.1%, a difference of 0.41%). Similarly, the demographic groups most similar to Immigrants from Fiji are Estonian (29.2%, a difference of 0.080%), Ukrainian (29.2%, a difference of 0.20%), Immigrants from Latvia (29.1%, a difference of 0.21%), Immigrants from Vietnam (29.3%, a difference of 0.34%), and Immigrants from Saudi Arabia (29.1%, a difference of 0.37%).
| Demographics | Rating | Rank | Births to Unmarried Women |
| Immigrants | Austria | 98.1 /100 | #81 | Exceptional 28.7% |
| Romanians | 98.0 /100 | #82 | Exceptional 28.7% |
| Immigrants | Kuwait | 98.0 /100 | #83 | Exceptional 28.8% |
| Immigrants | Poland | 97.6 /100 | #84 | Exceptional 28.9% |
| Sri Lankans | 97.5 /100 | #85 | Exceptional 28.9% |
| Immigrants | Jordan | 97.4 /100 | #86 | Exceptional 29.0% |
| Taiwanese | 97.3 /100 | #87 | Exceptional 29.0% |
| Immigrants | France | 97.3 /100 | #88 | Exceptional 29.0% |
| Immigrants | Saudi Arabia | 97.0 /100 | #89 | Exceptional 29.1% |
| Immigrants | Latvia | 96.8 /100 | #90 | Exceptional 29.1% |
| Immigrants | Fiji | 96.6 /100 | #91 | Exceptional 29.2% |
| Arabs | 96.5 /100 | #92 | Exceptional 29.2% |
| Estonians | 96.5 /100 | #93 | Exceptional 29.2% |
| Ukrainians | 96.3 /100 | #94 | Exceptional 29.2% |
| Immigrants | Vietnam | 96.1 /100 | #95 | Exceptional 29.3% |
| Norwegians | 95.8 /100 | #96 | Exceptional 29.3% |
| Immigrants | South Africa | 95.7 /100 | #97 | Exceptional 29.3% |
| Immigrants | Syria | 95.7 /100 | #98 | Exceptional 29.4% |
| Immigrants | Denmark | 95.3 /100 | #99 | Exceptional 29.4% |
| Luxembourgers | 95.2 /100 | #100 | Exceptional 29.4% |
| Immigrants | Northern Africa | 94.7 /100 | #101 | Exceptional 29.5% |