Scotch-Irish vs Immigrants from Fiji In Labor Force | Age 25-29
COMPARE
Scotch-Irish
Immigrants from Fiji
In Labor Force | Age 25-29
In Labor Force | Age 25-29 Comparison
Scotch-Irish
Immigrants from Fiji
84.2%
IN LABOR FORCE | AGE 25-29
6.5/ 100
METRIC RATING
223rd/ 347
METRIC RANK
83.6%
IN LABOR FORCE | AGE 25-29
0.1/ 100
METRIC RATING
262nd/ 347
METRIC RANK
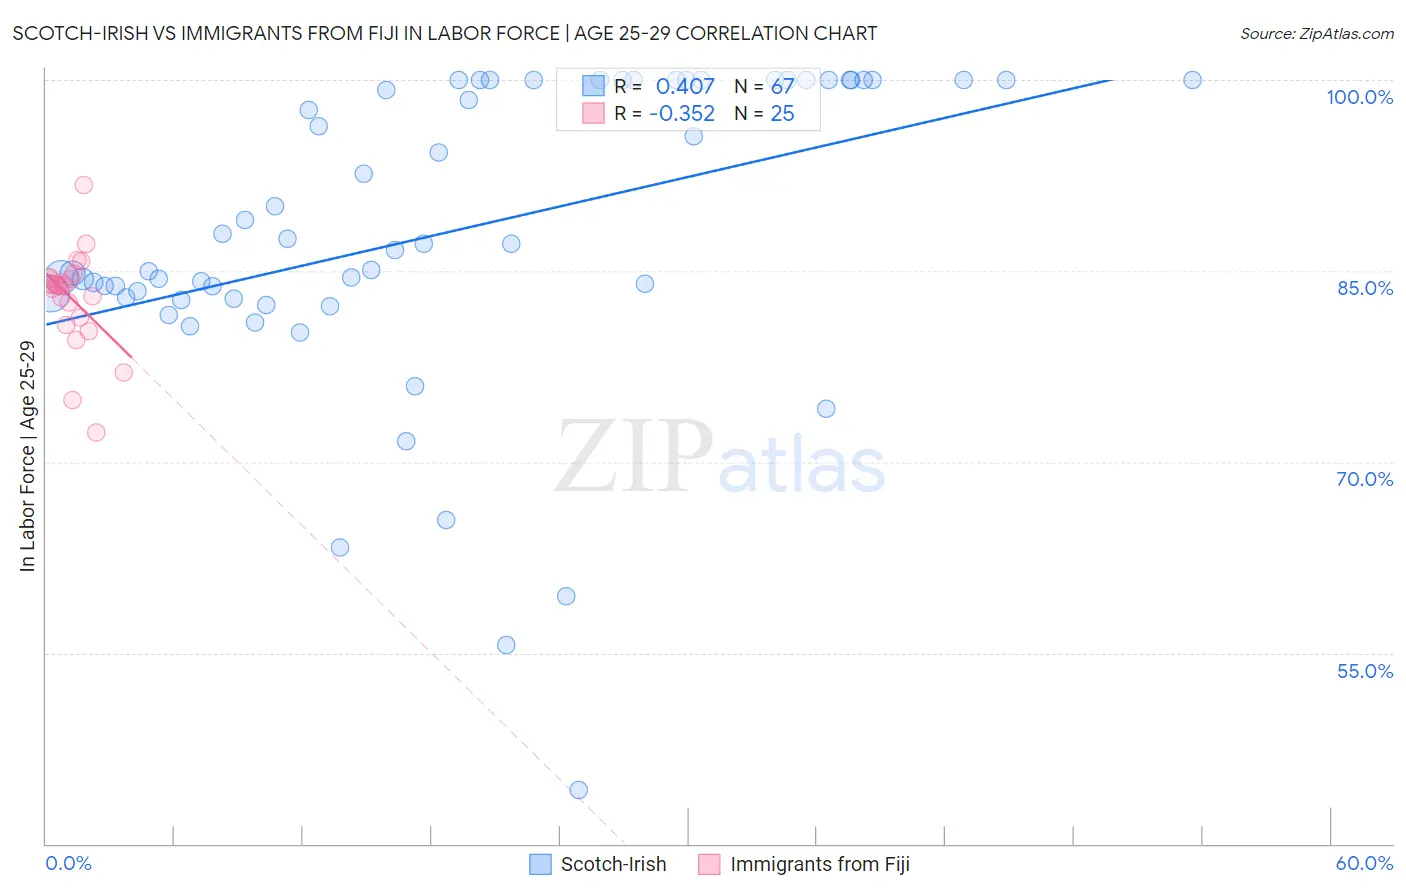
Scotch-Irish vs Immigrants from Fiji In Labor Force | Age 25-29 Correlation Chart
The statistical analysis conducted on geographies consisting of 547,797,884 people shows a moderate positive correlation between the proportion of Scotch-Irish and labor force participation rate among population between the ages 25 and 29 in the United States with a correlation coefficient (R) of 0.407 and weighted average of 84.2%. Similarly, the statistical analysis conducted on geographies consisting of 93,752,229 people shows a mild negative correlation between the proportion of Immigrants from Fiji and labor force participation rate among population between the ages 25 and 29 in the United States with a correlation coefficient (R) of -0.352 and weighted average of 83.6%, a difference of 0.81%.
In Labor Force | Age 25-29 Correlation Summary
| Measurement | Scotch-Irish | Immigrants from Fiji |
| Minimum | 44.2% | 72.3% |
| Maximum | 100.0% | 91.7% |
| Range | 55.8% | 19.4% |
| Mean | 88.0% | 82.8% |
| Median | 87.1% | 83.9% |
| Interquartile 25% (IQ1) | 82.9% | 81.1% |
| Interquartile 75% (IQ3) | 100.0% | 84.4% |
| Interquartile Range (IQR) | 17.1% | 3.3% |
| Standard Deviation (Sample) | 12.1% | 3.9% |
| Standard Deviation (Population) | 12.0% | 3.8% |
Similar Demographics by In Labor Force | Age 25-29
Demographics Similar to Scotch-Irish by In Labor Force | Age 25-29
In terms of in labor force | age 25-29, the demographic groups most similar to Scotch-Irish are Arab (84.2%, a difference of 0.010%), Jordanian (84.2%, a difference of 0.010%), Immigrants from West Indies (84.2%, a difference of 0.010%), Nigerian (84.3%, a difference of 0.020%), and Korean (84.2%, a difference of 0.020%).
| Demographics | Rating | Rank | In Labor Force | Age 25-29 |
| Israelis | 9.3 /100 | #216 | Tragic 84.3% |
| Immigrants | Ecuador | 9.3 /100 | #217 | Tragic 84.3% |
| Immigrants | Nigeria | 9.0 /100 | #218 | Tragic 84.3% |
| Immigrants | Saudi Arabia | 8.8 /100 | #219 | Tragic 84.3% |
| Nigerians | 7.2 /100 | #220 | Tragic 84.3% |
| Arabs | 6.8 /100 | #221 | Tragic 84.2% |
| Jordanians | 6.7 /100 | #222 | Tragic 84.2% |
| Scotch-Irish | 6.5 /100 | #223 | Tragic 84.2% |
| Immigrants | West Indies | 6.0 /100 | #224 | Tragic 84.2% |
| Koreans | 5.9 /100 | #225 | Tragic 84.2% |
| Immigrants | Congo | 5.8 /100 | #226 | Tragic 84.2% |
| French American Indians | 5.5 /100 | #227 | Tragic 84.2% |
| Immigrants | Panama | 5.5 /100 | #228 | Tragic 84.2% |
| Immigrants | Oceania | 5.0 /100 | #229 | Tragic 84.2% |
| Whites/Caucasians | 4.8 /100 | #230 | Tragic 84.2% |
Demographics Similar to Immigrants from Fiji by In Labor Force | Age 25-29
In terms of in labor force | age 25-29, the demographic groups most similar to Immigrants from Fiji are West Indian (83.5%, a difference of 0.040%), Pennsylvania German (83.6%, a difference of 0.060%), Immigrants from Bahamas (83.6%, a difference of 0.070%), Immigrants from Guatemala (83.6%, a difference of 0.080%), and Spanish (83.6%, a difference of 0.080%).
| Demographics | Rating | Rank | In Labor Force | Age 25-29 |
| Haitians | 0.2 /100 | #255 | Tragic 83.7% |
| Immigrants | Haiti | 0.2 /100 | #256 | Tragic 83.7% |
| Delaware | 0.2 /100 | #257 | Tragic 83.7% |
| Immigrants | Guatemala | 0.1 /100 | #258 | Tragic 83.6% |
| Spanish | 0.1 /100 | #259 | Tragic 83.6% |
| Immigrants | Bahamas | 0.1 /100 | #260 | Tragic 83.6% |
| Pennsylvania Germans | 0.1 /100 | #261 | Tragic 83.6% |
| Immigrants | Fiji | 0.1 /100 | #262 | Tragic 83.6% |
| West Indians | 0.1 /100 | #263 | Tragic 83.5% |
| Puget Sound Salish | 0.1 /100 | #264 | Tragic 83.5% |
| Cubans | 0.1 /100 | #265 | Tragic 83.5% |
| Aleuts | 0.0 /100 | #266 | Tragic 83.4% |
| Spanish Americans | 0.0 /100 | #267 | Tragic 83.4% |
| Immigrants | Lebanon | 0.0 /100 | #268 | Tragic 83.4% |
| Immigrants | Barbados | 0.0 /100 | #269 | Tragic 83.4% |