Guamanian/Chamorro vs Apache Births to Unmarried Women
COMPARE
Guamanian/Chamorro
Apache
Births to Unmarried Women
Births to Unmarried Women Comparison
Guamanians/Chamorros
Apache
31.6%
BIRTHS TO UNMARRIED WOMEN
51.3/ 100
METRIC RATING
170th/ 347
METRIC RANK
39.9%
BIRTHS TO UNMARRIED WOMEN
0.0/ 100
METRIC RATING
316th/ 347
METRIC RANK
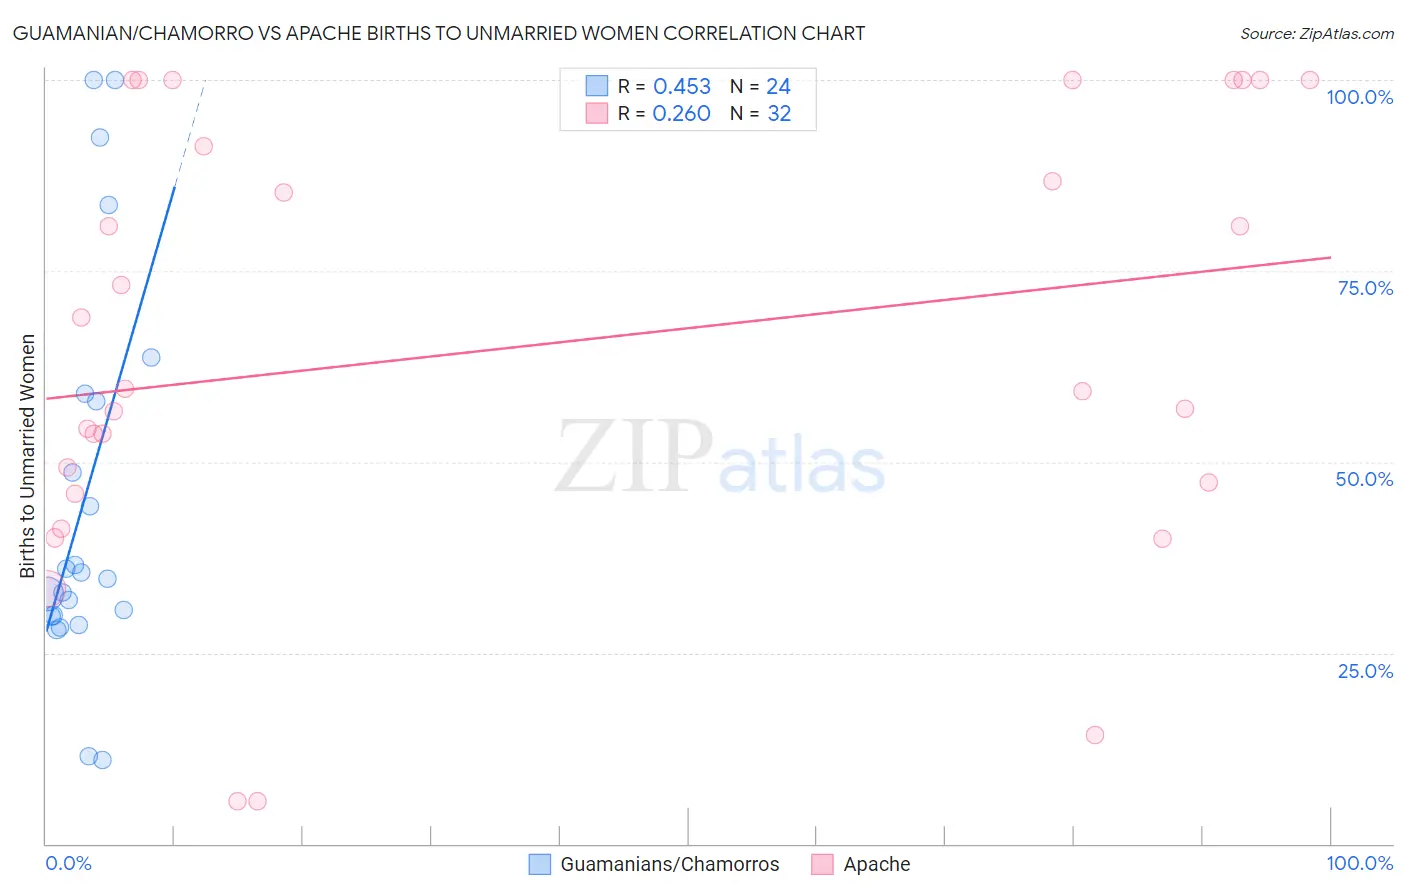
Guamanian/Chamorro vs Apache Births to Unmarried Women Correlation Chart
The statistical analysis conducted on geographies consisting of 213,790,025 people shows a moderate positive correlation between the proportion of Guamanians/Chamorros and percentage of births to unmarried women in the United States with a correlation coefficient (R) of 0.453 and weighted average of 31.6%. Similarly, the statistical analysis conducted on geographies consisting of 223,899,769 people shows a weak positive correlation between the proportion of Apache and percentage of births to unmarried women in the United States with a correlation coefficient (R) of 0.260 and weighted average of 39.9%, a difference of 26.0%.
Births to Unmarried Women Correlation Summary
| Measurement | Guamanian/Chamorro | Apache |
| Minimum | 10.9% | 5.6% |
| Maximum | 100.0% | 100.0% |
| Range | 89.1% | 94.4% |
| Mean | 45.3% | 65.1% |
| Median | 35.1% | 59.4% |
| Interquartile 25% (IQ1) | 29.8% | 46.6% |
| Interquartile 75% (IQ3) | 58.4% | 95.7% |
| Interquartile Range (IQR) | 28.6% | 49.1% |
| Standard Deviation (Sample) | 25.6% | 28.9% |
| Standard Deviation (Population) | 25.1% | 28.4% |
Similar Demographics by Births to Unmarried Women
Demographics Similar to Guamanians/Chamorros by Births to Unmarried Women
In terms of births to unmarried women, the demographic groups most similar to Guamanians/Chamorros are Slavic (31.6%, a difference of 0.070%), Finnish (31.7%, a difference of 0.080%), Immigrants from Eritrea (31.7%, a difference of 0.090%), Belgian (31.6%, a difference of 0.10%), and Immigrants from Yemen (31.7%, a difference of 0.10%).
| Demographics | Rating | Rank | Births to Unmarried Women |
| Immigrants | Chile | 65.7 /100 | #163 | Good 31.2% |
| Hungarians | 64.1 /100 | #164 | Good 31.2% |
| Immigrants | Somalia | 58.1 /100 | #165 | Average 31.4% |
| Peruvians | 55.5 /100 | #166 | Average 31.5% |
| Dutch | 55.3 /100 | #167 | Average 31.5% |
| Belgians | 52.4 /100 | #168 | Average 31.6% |
| Slavs | 52.0 /100 | #169 | Average 31.6% |
| Guamanians/Chamorros | 51.3 /100 | #170 | Average 31.6% |
| Finns | 50.5 /100 | #171 | Average 31.7% |
| Immigrants | Eritrea | 50.4 /100 | #172 | Average 31.7% |
| Immigrants | Yemen | 50.2 /100 | #173 | Average 31.7% |
| Venezuelans | 50.0 /100 | #174 | Average 31.7% |
| Immigrants | Venezuela | 49.2 /100 | #175 | Average 31.7% |
| Scottish | 48.1 /100 | #176 | Average 31.7% |
| South American Indians | 47.7 /100 | #177 | Average 31.7% |
Demographics Similar to Apache by Births to Unmarried Women
In terms of births to unmarried women, the demographic groups most similar to Apache are Dominican (39.8%, a difference of 0.060%), Immigrants from Caribbean (39.8%, a difference of 0.10%), African (39.7%, a difference of 0.38%), Immigrants from Dominican Republic (40.1%, a difference of 0.55%), and Immigrants from Bahamas (40.1%, a difference of 0.62%).
| Demographics | Rating | Rank | Births to Unmarried Women |
| Cubans | 0.0 /100 | #309 | Tragic 39.4% |
| Immigrants | Dominica | 0.0 /100 | #310 | Tragic 39.5% |
| Immigrants | Azores | 0.0 /100 | #311 | Tragic 39.6% |
| U.S. Virgin Islanders | 0.0 /100 | #312 | Tragic 39.6% |
| Africans | 0.0 /100 | #313 | Tragic 39.7% |
| Immigrants | Caribbean | 0.0 /100 | #314 | Tragic 39.8% |
| Dominicans | 0.0 /100 | #315 | Tragic 39.8% |
| Apache | 0.0 /100 | #316 | Tragic 39.9% |
| Immigrants | Dominican Republic | 0.0 /100 | #317 | Tragic 40.1% |
| Immigrants | Bahamas | 0.0 /100 | #318 | Tragic 40.1% |
| Yakama | 0.0 /100 | #319 | Tragic 40.3% |
| Crow | 0.0 /100 | #320 | Tragic 40.4% |
| Bahamians | 0.0 /100 | #321 | Tragic 40.8% |
| Cajuns | 0.0 /100 | #322 | Tragic 41.0% |
| Sioux | 0.0 /100 | #323 | Tragic 41.0% |