Immigrants from Cameroon vs Apache Births to Unmarried Women
COMPARE
Immigrants from Cameroon
Apache
Births to Unmarried Women
Births to Unmarried Women Comparison
Immigrants from Cameroon
Apache
34.7%
BIRTHS TO UNMARRIED WOMEN
1.6/ 100
METRIC RATING
236th/ 347
METRIC RANK
39.9%
BIRTHS TO UNMARRIED WOMEN
0.0/ 100
METRIC RATING
316th/ 347
METRIC RANK
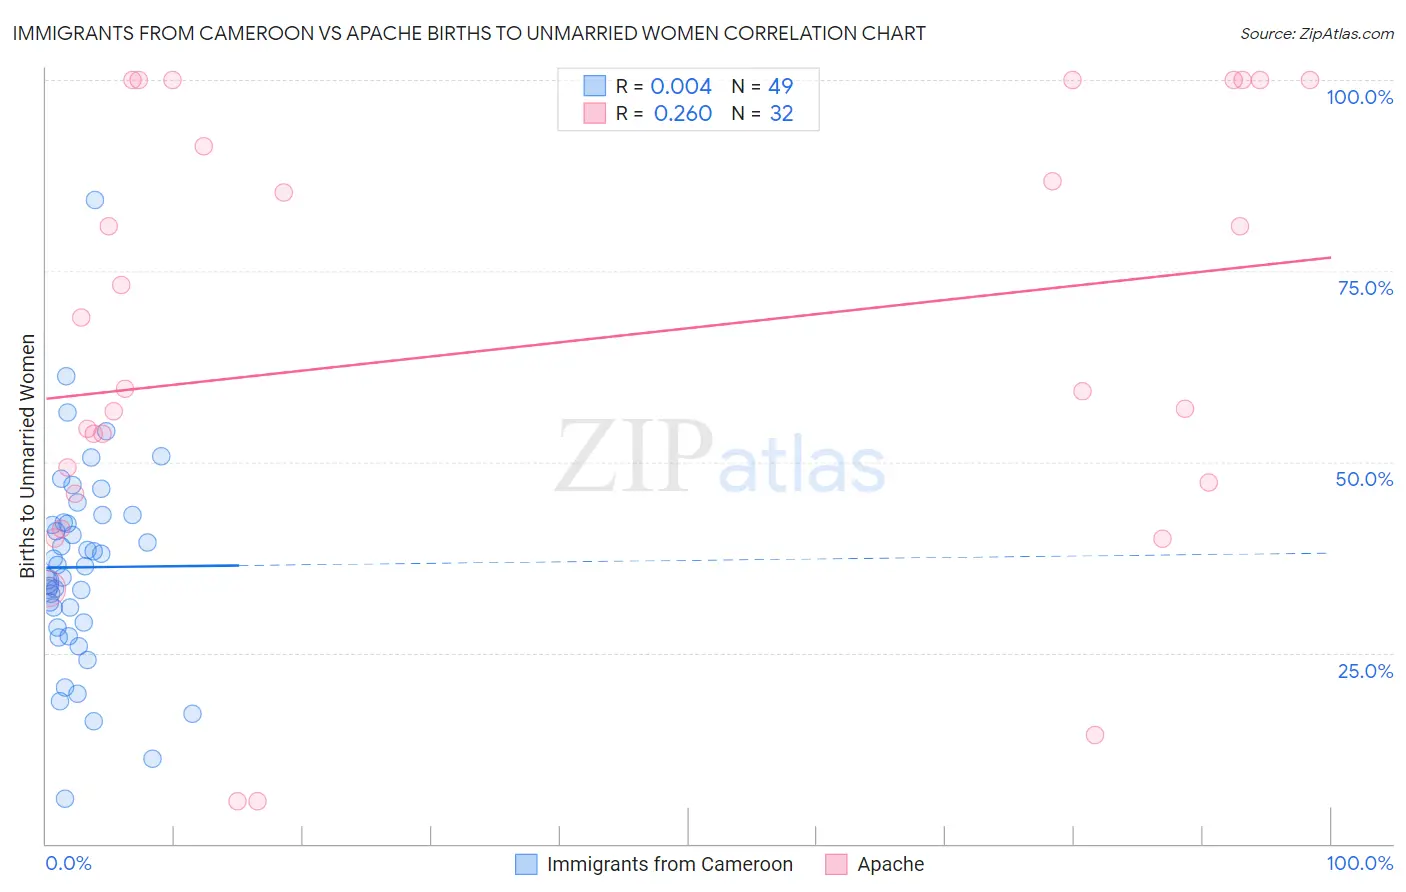
Immigrants from Cameroon vs Apache Births to Unmarried Women Correlation Chart
The statistical analysis conducted on geographies consisting of 128,569,403 people shows no correlation between the proportion of Immigrants from Cameroon and percentage of births to unmarried women in the United States with a correlation coefficient (R) of 0.004 and weighted average of 34.7%. Similarly, the statistical analysis conducted on geographies consisting of 223,899,769 people shows a weak positive correlation between the proportion of Apache and percentage of births to unmarried women in the United States with a correlation coefficient (R) of 0.260 and weighted average of 39.9%, a difference of 14.8%.
Births to Unmarried Women Correlation Summary
| Measurement | Immigrants from Cameroon | Apache |
| Minimum | 5.9% | 5.6% |
| Maximum | 84.3% | 100.0% |
| Range | 78.4% | 94.4% |
| Mean | 36.2% | 65.1% |
| Median | 36.4% | 59.4% |
| Interquartile 25% (IQ1) | 28.6% | 46.6% |
| Interquartile 75% (IQ3) | 42.5% | 95.7% |
| Interquartile Range (IQR) | 13.9% | 49.1% |
| Standard Deviation (Sample) | 13.4% | 28.9% |
| Standard Deviation (Population) | 13.2% | 28.4% |
Similar Demographics by Births to Unmarried Women
Demographics Similar to Immigrants from Cameroon by Births to Unmarried Women
In terms of births to unmarried women, the demographic groups most similar to Immigrants from Cameroon are Marshallese (34.8%, a difference of 0.070%), Immigrants from Cambodia (34.8%, a difference of 0.13%), Sierra Leonean (34.9%, a difference of 0.36%), Immigrants from Middle Africa (34.9%, a difference of 0.61%), and Immigrants from Ghana (34.5%, a difference of 0.63%).
| Demographics | Rating | Rank | Births to Unmarried Women |
| Immigrants | Sierra Leone | 3.1 /100 | #229 | Tragic 34.2% |
| Ghanaians | 3.1 /100 | #230 | Tragic 34.3% |
| Native Hawaiians | 2.9 /100 | #231 | Tragic 34.3% |
| French Canadians | 2.5 /100 | #232 | Tragic 34.4% |
| Bangladeshis | 2.5 /100 | #233 | Tragic 34.4% |
| Immigrants | Zaire | 2.3 /100 | #234 | Tragic 34.5% |
| Immigrants | Ghana | 2.2 /100 | #235 | Tragic 34.5% |
| Immigrants | Cameroon | 1.6 /100 | #236 | Tragic 34.7% |
| Marshallese | 1.6 /100 | #237 | Tragic 34.8% |
| Immigrants | Cambodia | 1.6 /100 | #238 | Tragic 34.8% |
| Sierra Leoneans | 1.4 /100 | #239 | Tragic 34.9% |
| Immigrants | Middle Africa | 1.2 /100 | #240 | Tragic 34.9% |
| Immigrants | Guyana | 1.2 /100 | #241 | Tragic 35.0% |
| Indonesians | 1.2 /100 | #242 | Tragic 35.0% |
| Japanese | 0.9 /100 | #243 | Tragic 35.2% |
Demographics Similar to Apache by Births to Unmarried Women
In terms of births to unmarried women, the demographic groups most similar to Apache are Dominican (39.8%, a difference of 0.060%), Immigrants from Caribbean (39.8%, a difference of 0.10%), African (39.7%, a difference of 0.38%), Immigrants from Dominican Republic (40.1%, a difference of 0.55%), and Immigrants from Bahamas (40.1%, a difference of 0.62%).
| Demographics | Rating | Rank | Births to Unmarried Women |
| Cubans | 0.0 /100 | #309 | Tragic 39.4% |
| Immigrants | Dominica | 0.0 /100 | #310 | Tragic 39.5% |
| Immigrants | Azores | 0.0 /100 | #311 | Tragic 39.6% |
| U.S. Virgin Islanders | 0.0 /100 | #312 | Tragic 39.6% |
| Africans | 0.0 /100 | #313 | Tragic 39.7% |
| Immigrants | Caribbean | 0.0 /100 | #314 | Tragic 39.8% |
| Dominicans | 0.0 /100 | #315 | Tragic 39.8% |
| Apache | 0.0 /100 | #316 | Tragic 39.9% |
| Immigrants | Dominican Republic | 0.0 /100 | #317 | Tragic 40.1% |
| Immigrants | Bahamas | 0.0 /100 | #318 | Tragic 40.1% |
| Yakama | 0.0 /100 | #319 | Tragic 40.3% |
| Crow | 0.0 /100 | #320 | Tragic 40.4% |
| Bahamians | 0.0 /100 | #321 | Tragic 40.8% |
| Cajuns | 0.0 /100 | #322 | Tragic 41.0% |
| Sioux | 0.0 /100 | #323 | Tragic 41.0% |