Lumbee vs Subsaharan African Married-couple Households
COMPARE
Lumbee
Subsaharan African
Married-couple Households
Married-couple Households Comparison
Lumbee
Sub-Saharan Africans
39.6%
MARRIED-COUPLE HOUSEHOLDS
0.0/ 100
METRIC RATING
327th/ 347
METRIC RANK
41.6%
MARRIED-COUPLE HOUSEHOLDS
0.0/ 100
METRIC RATING
303rd/ 347
METRIC RANK
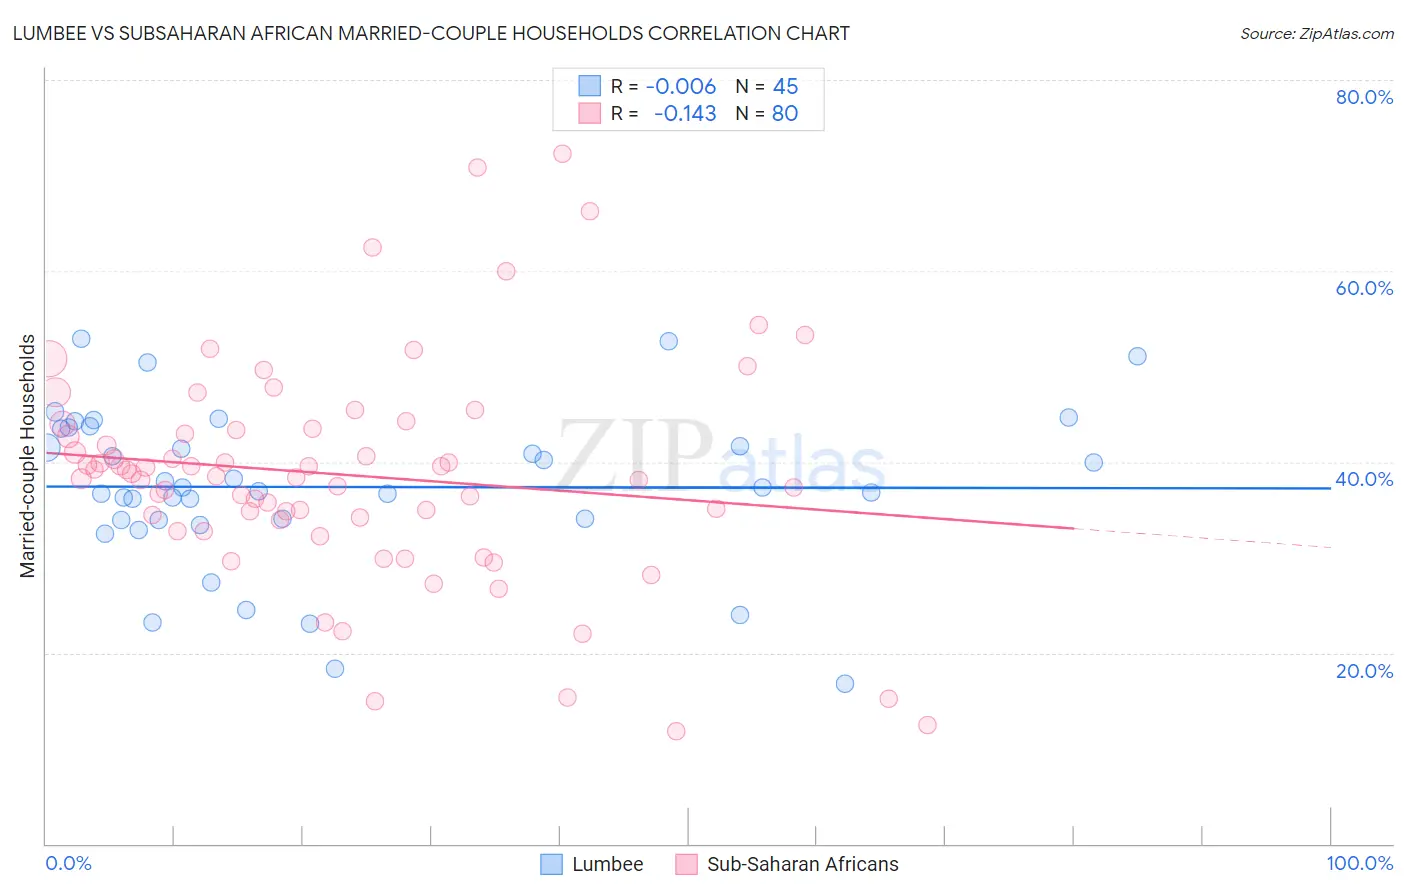
Lumbee vs Subsaharan African Married-couple Households Correlation Chart
The statistical analysis conducted on geographies consisting of 92,264,260 people shows no correlation between the proportion of Lumbee and percentage of married-couple family households in the United States with a correlation coefficient (R) of -0.006 and weighted average of 39.6%. Similarly, the statistical analysis conducted on geographies consisting of 507,572,233 people shows a poor negative correlation between the proportion of Sub-Saharan Africans and percentage of married-couple family households in the United States with a correlation coefficient (R) of -0.143 and weighted average of 41.6%, a difference of 5.1%.
Married-couple Households Correlation Summary
| Measurement | Lumbee | Subsaharan African |
| Minimum | 16.8% | 11.8% |
| Maximum | 53.0% | 72.3% |
| Range | 36.2% | 60.5% |
| Mean | 37.4% | 38.7% |
| Median | 37.3% | 38.6% |
| Interquartile 25% (IQ1) | 33.9% | 34.1% |
| Interquartile 75% (IQ3) | 43.5% | 43.4% |
| Interquartile Range (IQR) | 9.7% | 9.3% |
| Standard Deviation (Sample) | 8.3% | 11.6% |
| Standard Deviation (Population) | 8.2% | 11.5% |
Similar Demographics by Married-couple Households
Demographics Similar to Lumbee by Married-couple Households
In terms of married-couple households, the demographic groups most similar to Lumbee are U.S. Virgin Islander (39.8%, a difference of 0.47%), Barbadian (39.4%, a difference of 0.50%), Immigrants from Dominica (39.4%, a difference of 0.57%), Pueblo (40.0%, a difference of 0.93%), and Immigrants from Barbados (39.2%, a difference of 1.0%).
| Demographics | Rating | Rank | Married-couple Households |
| West Indians | 0.0 /100 | #320 | Tragic 40.3% |
| Immigrants | Liberia | 0.0 /100 | #321 | Tragic 40.3% |
| Immigrants | Zaire | 0.0 /100 | #322 | Tragic 40.1% |
| Puerto Ricans | 0.0 /100 | #323 | Tragic 40.1% |
| Navajo | 0.0 /100 | #324 | Tragic 40.1% |
| Pueblo | 0.0 /100 | #325 | Tragic 40.0% |
| U.S. Virgin Islanders | 0.0 /100 | #326 | Tragic 39.8% |
| Lumbee | 0.0 /100 | #327 | Tragic 39.6% |
| Barbadians | 0.0 /100 | #328 | Tragic 39.4% |
| Immigrants | Dominica | 0.0 /100 | #329 | Tragic 39.4% |
| Immigrants | Barbados | 0.0 /100 | #330 | Tragic 39.2% |
| Immigrants | Congo | 0.0 /100 | #331 | Tragic 39.0% |
| Somalis | 0.0 /100 | #332 | Tragic 39.0% |
| Immigrants | West Indies | 0.0 /100 | #333 | Tragic 39.0% |
| Immigrants | St. Vincent and the Grenadines | 0.0 /100 | #334 | Tragic 38.7% |
Demographics Similar to Sub-Saharan Africans by Married-couple Households
In terms of married-couple households, the demographic groups most similar to Sub-Saharan Africans are Immigrants from Honduras (41.6%, a difference of 0.0%), Immigrants from Guyana (41.6%, a difference of 0.11%), Immigrants from Bahamas (41.7%, a difference of 0.18%), Sioux (41.5%, a difference of 0.22%), and Immigrants from Belize (41.8%, a difference of 0.39%).
| Demographics | Rating | Rank | Married-couple Households |
| Immigrants | Sudan | 0.0 /100 | #296 | Tragic 41.9% |
| Arapaho | 0.0 /100 | #297 | Tragic 41.8% |
| Immigrants | Middle Africa | 0.0 /100 | #298 | Tragic 41.8% |
| Immigrants | Ghana | 0.0 /100 | #299 | Tragic 41.8% |
| Immigrants | Belize | 0.0 /100 | #300 | Tragic 41.8% |
| Immigrants | Bahamas | 0.0 /100 | #301 | Tragic 41.7% |
| Immigrants | Honduras | 0.0 /100 | #302 | Tragic 41.6% |
| Sub-Saharan Africans | 0.0 /100 | #303 | Tragic 41.6% |
| Immigrants | Guyana | 0.0 /100 | #304 | Tragic 41.6% |
| Sioux | 0.0 /100 | #305 | Tragic 41.5% |
| Guyanese | 0.0 /100 | #306 | Tragic 41.4% |
| Immigrants | Western Africa | 0.0 /100 | #307 | Tragic 41.4% |
| Crow | 0.0 /100 | #308 | Tragic 41.4% |
| Immigrants | Trinidad and Tobago | 0.0 /100 | #309 | Tragic 41.2% |
| Haitians | 0.0 /100 | #310 | Tragic 41.2% |