Immigrants from Panama vs Subsaharan African Married-couple Households
COMPARE
Immigrants from Panama
Subsaharan African
Married-couple Households
Married-couple Households Comparison
Immigrants from Panama
Sub-Saharan Africans
44.6%
MARRIED-COUPLE HOUSEHOLDS
1.3/ 100
METRIC RATING
234th/ 347
METRIC RANK
41.6%
MARRIED-COUPLE HOUSEHOLDS
0.0/ 100
METRIC RATING
303rd/ 347
METRIC RANK
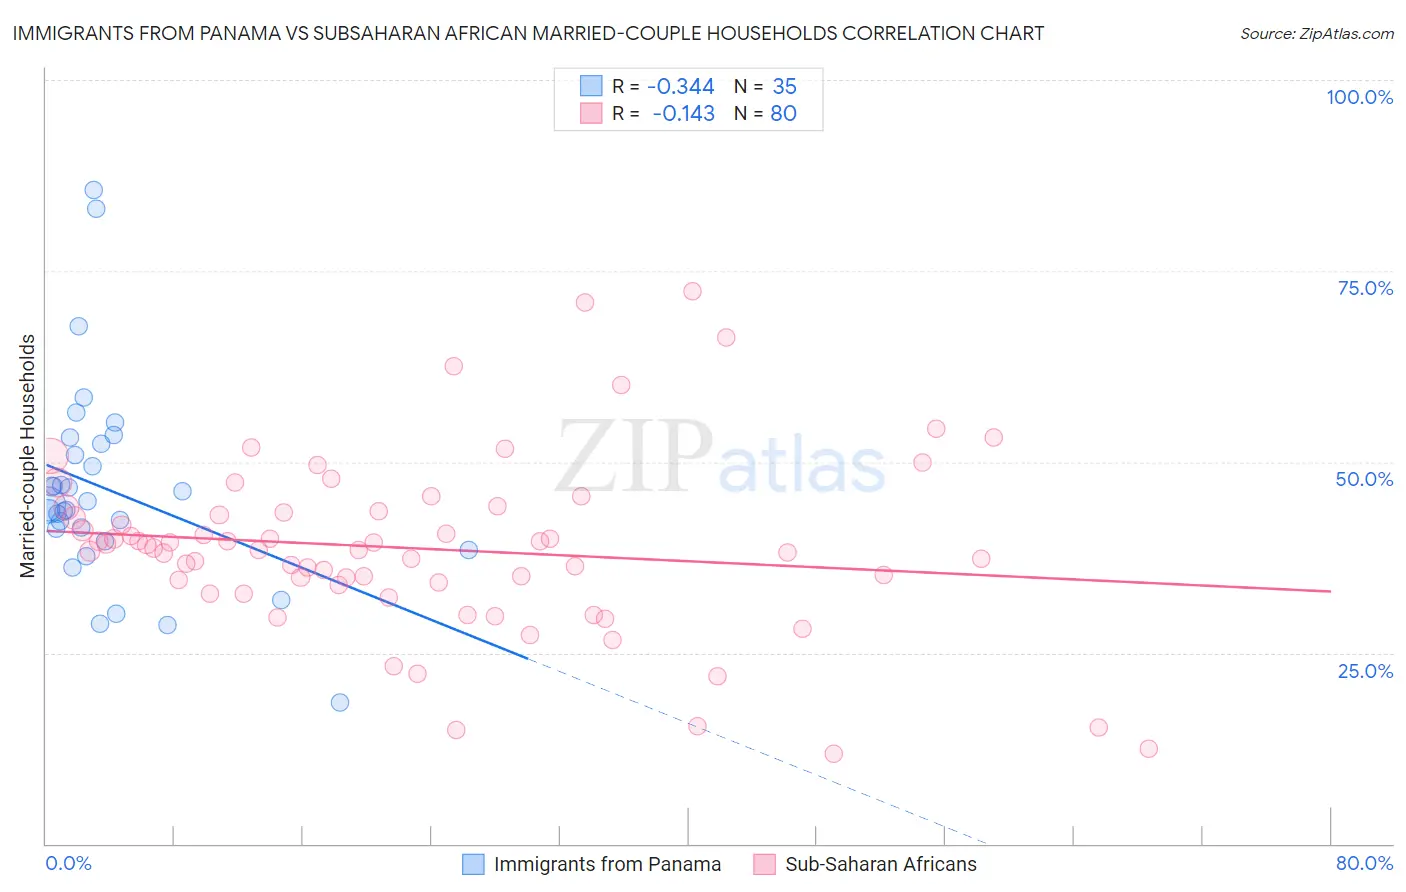
Immigrants from Panama vs Subsaharan African Married-couple Households Correlation Chart
The statistical analysis conducted on geographies consisting of 221,156,465 people shows a mild negative correlation between the proportion of Immigrants from Panama and percentage of married-couple family households in the United States with a correlation coefficient (R) of -0.344 and weighted average of 44.6%. Similarly, the statistical analysis conducted on geographies consisting of 507,572,233 people shows a poor negative correlation between the proportion of Sub-Saharan Africans and percentage of married-couple family households in the United States with a correlation coefficient (R) of -0.143 and weighted average of 41.6%, a difference of 7.1%.
Married-couple Households Correlation Summary
| Measurement | Immigrants from Panama | Subsaharan African |
| Minimum | 18.6% | 11.8% |
| Maximum | 85.7% | 72.3% |
| Range | 67.1% | 60.5% |
| Mean | 46.3% | 38.7% |
| Median | 44.4% | 38.6% |
| Interquartile 25% (IQ1) | 39.6% | 34.1% |
| Interquartile 75% (IQ3) | 52.4% | 43.4% |
| Interquartile Range (IQR) | 12.9% | 9.3% |
| Standard Deviation (Sample) | 13.4% | 11.6% |
| Standard Deviation (Population) | 13.2% | 11.5% |
Similar Demographics by Married-couple Households
Demographics Similar to Immigrants from Panama by Married-couple Households
In terms of married-couple households, the demographic groups most similar to Immigrants from Panama are Immigrants from Nicaragua (44.5%, a difference of 0.070%), Yaqui (44.5%, a difference of 0.080%), Comanche (44.5%, a difference of 0.11%), Immigrants from Uganda (44.6%, a difference of 0.12%), and Houma (44.6%, a difference of 0.16%).
| Demographics | Rating | Rank | Married-couple Households |
| Salvadorans | 1.9 /100 | #227 | Tragic 44.7% |
| Kenyans | 1.7 /100 | #228 | Tragic 44.7% |
| Immigrants | Latin America | 1.6 /100 | #229 | Tragic 44.7% |
| Soviet Union | 1.6 /100 | #230 | Tragic 44.6% |
| Houma | 1.5 /100 | #231 | Tragic 44.6% |
| Marshallese | 1.5 /100 | #232 | Tragic 44.6% |
| Immigrants | Uganda | 1.5 /100 | #233 | Tragic 44.6% |
| Immigrants | Panama | 1.3 /100 | #234 | Tragic 44.6% |
| Immigrants | Nicaragua | 1.2 /100 | #235 | Tragic 44.5% |
| Yaqui | 1.2 /100 | #236 | Tragic 44.5% |
| Comanche | 1.2 /100 | #237 | Tragic 44.5% |
| Immigrants | Uruguay | 1.1 /100 | #238 | Tragic 44.5% |
| Spanish Americans | 1.1 /100 | #239 | Tragic 44.5% |
| Ute | 1.0 /100 | #240 | Tragic 44.4% |
| Immigrants | Bosnia and Herzegovina | 1.0 /100 | #241 | Tragic 44.4% |
Demographics Similar to Sub-Saharan Africans by Married-couple Households
In terms of married-couple households, the demographic groups most similar to Sub-Saharan Africans are Immigrants from Honduras (41.6%, a difference of 0.0%), Immigrants from Guyana (41.6%, a difference of 0.11%), Immigrants from Bahamas (41.7%, a difference of 0.18%), Sioux (41.5%, a difference of 0.22%), and Immigrants from Belize (41.8%, a difference of 0.39%).
| Demographics | Rating | Rank | Married-couple Households |
| Immigrants | Sudan | 0.0 /100 | #296 | Tragic 41.9% |
| Arapaho | 0.0 /100 | #297 | Tragic 41.8% |
| Immigrants | Middle Africa | 0.0 /100 | #298 | Tragic 41.8% |
| Immigrants | Ghana | 0.0 /100 | #299 | Tragic 41.8% |
| Immigrants | Belize | 0.0 /100 | #300 | Tragic 41.8% |
| Immigrants | Bahamas | 0.0 /100 | #301 | Tragic 41.7% |
| Immigrants | Honduras | 0.0 /100 | #302 | Tragic 41.6% |
| Sub-Saharan Africans | 0.0 /100 | #303 | Tragic 41.6% |
| Immigrants | Guyana | 0.0 /100 | #304 | Tragic 41.6% |
| Sioux | 0.0 /100 | #305 | Tragic 41.5% |
| Guyanese | 0.0 /100 | #306 | Tragic 41.4% |
| Immigrants | Western Africa | 0.0 /100 | #307 | Tragic 41.4% |
| Crow | 0.0 /100 | #308 | Tragic 41.4% |
| Immigrants | Trinidad and Tobago | 0.0 /100 | #309 | Tragic 41.2% |
| Haitians | 0.0 /100 | #310 | Tragic 41.2% |