Lumbee vs French Married-couple Households
COMPARE
Lumbee
French
Married-couple Households
Married-couple Households Comparison
Lumbee
French
39.6%
MARRIED-COUPLE HOUSEHOLDS
0.0/ 100
METRIC RATING
327th/ 347
METRIC RANK
48.0%
MARRIED-COUPLE HOUSEHOLDS
97.2/ 100
METRIC RATING
90th/ 347
METRIC RANK
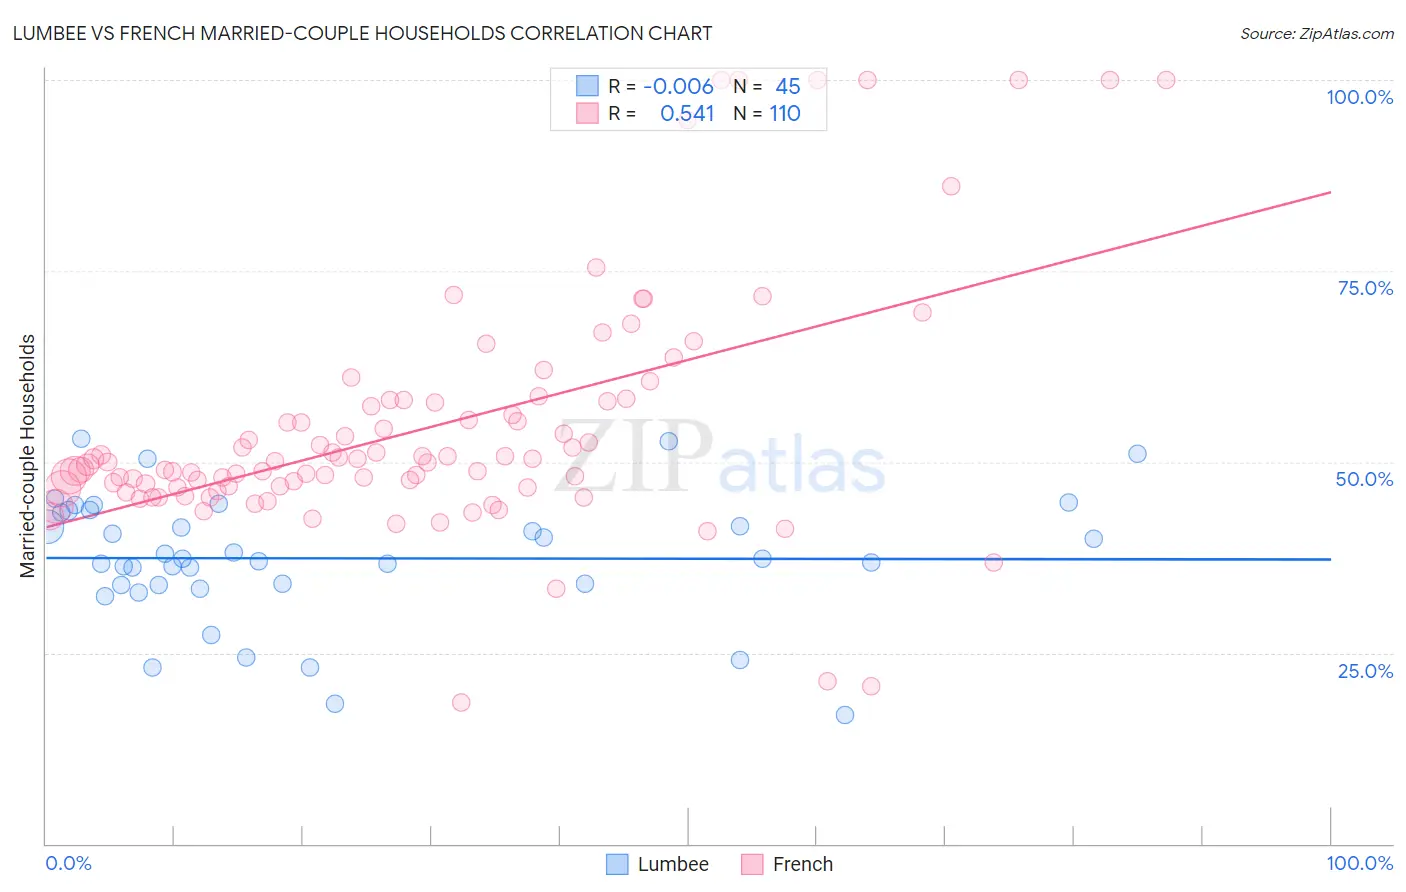
Lumbee vs French Married-couple Households Correlation Chart
The statistical analysis conducted on geographies consisting of 92,264,260 people shows no correlation between the proportion of Lumbee and percentage of married-couple family households in the United States with a correlation coefficient (R) of -0.006 and weighted average of 39.6%. Similarly, the statistical analysis conducted on geographies consisting of 571,775,805 people shows a substantial positive correlation between the proportion of French and percentage of married-couple family households in the United States with a correlation coefficient (R) of 0.541 and weighted average of 48.0%, a difference of 21.2%.
Married-couple Households Correlation Summary
| Measurement | Lumbee | French |
| Minimum | 16.8% | 18.5% |
| Maximum | 53.0% | 100.0% |
| Range | 36.2% | 81.5% |
| Mean | 37.4% | 54.4% |
| Median | 37.3% | 49.9% |
| Interquartile 25% (IQ1) | 33.9% | 46.7% |
| Interquartile 75% (IQ3) | 43.5% | 57.9% |
| Interquartile Range (IQR) | 9.7% | 11.2% |
| Standard Deviation (Sample) | 8.3% | 16.0% |
| Standard Deviation (Population) | 8.2% | 15.9% |
Similar Demographics by Married-couple Households
Demographics Similar to Lumbee by Married-couple Households
In terms of married-couple households, the demographic groups most similar to Lumbee are U.S. Virgin Islander (39.8%, a difference of 0.47%), Barbadian (39.4%, a difference of 0.50%), Immigrants from Dominica (39.4%, a difference of 0.57%), Pueblo (40.0%, a difference of 0.93%), and Immigrants from Barbados (39.2%, a difference of 1.0%).
| Demographics | Rating | Rank | Married-couple Households |
| West Indians | 0.0 /100 | #320 | Tragic 40.3% |
| Immigrants | Liberia | 0.0 /100 | #321 | Tragic 40.3% |
| Immigrants | Zaire | 0.0 /100 | #322 | Tragic 40.1% |
| Puerto Ricans | 0.0 /100 | #323 | Tragic 40.1% |
| Navajo | 0.0 /100 | #324 | Tragic 40.1% |
| Pueblo | 0.0 /100 | #325 | Tragic 40.0% |
| U.S. Virgin Islanders | 0.0 /100 | #326 | Tragic 39.8% |
| Lumbee | 0.0 /100 | #327 | Tragic 39.6% |
| Barbadians | 0.0 /100 | #328 | Tragic 39.4% |
| Immigrants | Dominica | 0.0 /100 | #329 | Tragic 39.4% |
| Immigrants | Barbados | 0.0 /100 | #330 | Tragic 39.2% |
| Immigrants | Congo | 0.0 /100 | #331 | Tragic 39.0% |
| Somalis | 0.0 /100 | #332 | Tragic 39.0% |
| Immigrants | West Indies | 0.0 /100 | #333 | Tragic 39.0% |
| Immigrants | St. Vincent and the Grenadines | 0.0 /100 | #334 | Tragic 38.7% |
Demographics Similar to French by Married-couple Households
In terms of married-couple households, the demographic groups most similar to French are Cypriot (48.0%, a difference of 0.010%), Afghan (48.0%, a difference of 0.040%), Immigrants from Ireland (48.0%, a difference of 0.050%), Belgian (48.0%, a difference of 0.060%), and Immigrants from Moldova (48.0%, a difference of 0.060%).
| Demographics | Rating | Rank | Married-couple Households |
| Guamanians/Chamorros | 97.6 /100 | #83 | Exceptional 48.1% |
| Ukrainians | 97.6 /100 | #84 | Exceptional 48.1% |
| Immigrants | Israel | 97.4 /100 | #85 | Exceptional 48.0% |
| Belgians | 97.4 /100 | #86 | Exceptional 48.0% |
| Immigrants | Ireland | 97.3 /100 | #87 | Exceptional 48.0% |
| Afghans | 97.3 /100 | #88 | Exceptional 48.0% |
| Cypriots | 97.2 /100 | #89 | Exceptional 48.0% |
| French | 97.2 /100 | #90 | Exceptional 48.0% |
| Immigrants | Moldova | 97.0 /100 | #91 | Exceptional 48.0% |
| Palestinians | 96.9 /100 | #92 | Exceptional 48.0% |
| Lebanese | 96.9 /100 | #93 | Exceptional 47.9% |
| Americans | 96.9 /100 | #94 | Exceptional 47.9% |
| Immigrants | Belgium | 96.8 /100 | #95 | Exceptional 47.9% |
| Immigrants | Egypt | 96.6 /100 | #96 | Exceptional 47.9% |
| Latvians | 96.5 /100 | #97 | Exceptional 47.9% |