Lumbee vs Cambodian Married-couple Households
COMPARE
Lumbee
Cambodian
Married-couple Households
Married-couple Households Comparison
Lumbee
Cambodians
39.6%
MARRIED-COUPLE HOUSEHOLDS
0.0/ 100
METRIC RATING
327th/ 347
METRIC RANK
45.9%
MARRIED-COUPLE HOUSEHOLDS
21.3/ 100
METRIC RATING
197th/ 347
METRIC RANK
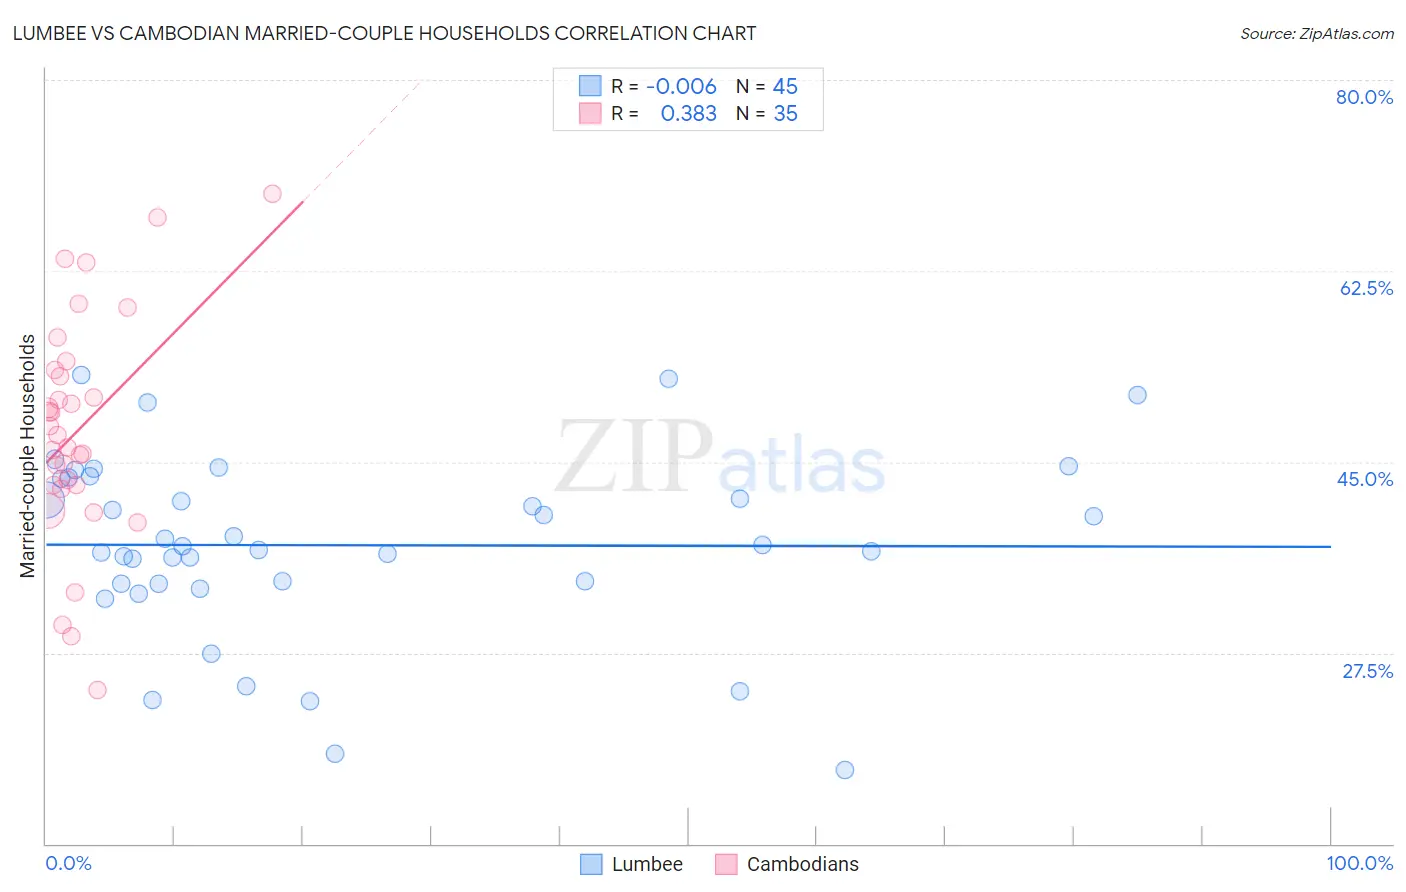
Lumbee vs Cambodian Married-couple Households Correlation Chart
The statistical analysis conducted on geographies consisting of 92,264,260 people shows no correlation between the proportion of Lumbee and percentage of married-couple family households in the United States with a correlation coefficient (R) of -0.006 and weighted average of 39.6%. Similarly, the statistical analysis conducted on geographies consisting of 102,469,130 people shows a mild positive correlation between the proportion of Cambodians and percentage of married-couple family households in the United States with a correlation coefficient (R) of 0.383 and weighted average of 45.9%, a difference of 15.8%.
Married-couple Households Correlation Summary
| Measurement | Lumbee | Cambodian |
| Minimum | 16.8% | 24.1% |
| Maximum | 53.0% | 69.5% |
| Range | 36.2% | 45.4% |
| Mean | 37.4% | 47.9% |
| Median | 37.3% | 47.5% |
| Interquartile 25% (IQ1) | 33.9% | 42.9% |
| Interquartile 75% (IQ3) | 43.5% | 53.4% |
| Interquartile Range (IQR) | 9.7% | 10.5% |
| Standard Deviation (Sample) | 8.3% | 10.2% |
| Standard Deviation (Population) | 8.2% | 10.1% |
Similar Demographics by Married-couple Households
Demographics Similar to Lumbee by Married-couple Households
In terms of married-couple households, the demographic groups most similar to Lumbee are U.S. Virgin Islander (39.8%, a difference of 0.47%), Barbadian (39.4%, a difference of 0.50%), Immigrants from Dominica (39.4%, a difference of 0.57%), Pueblo (40.0%, a difference of 0.93%), and Immigrants from Barbados (39.2%, a difference of 1.0%).
| Demographics | Rating | Rank | Married-couple Households |
| West Indians | 0.0 /100 | #320 | Tragic 40.3% |
| Immigrants | Liberia | 0.0 /100 | #321 | Tragic 40.3% |
| Immigrants | Zaire | 0.0 /100 | #322 | Tragic 40.1% |
| Puerto Ricans | 0.0 /100 | #323 | Tragic 40.1% |
| Navajo | 0.0 /100 | #324 | Tragic 40.1% |
| Pueblo | 0.0 /100 | #325 | Tragic 40.0% |
| U.S. Virgin Islanders | 0.0 /100 | #326 | Tragic 39.8% |
| Lumbee | 0.0 /100 | #327 | Tragic 39.6% |
| Barbadians | 0.0 /100 | #328 | Tragic 39.4% |
| Immigrants | Dominica | 0.0 /100 | #329 | Tragic 39.4% |
| Immigrants | Barbados | 0.0 /100 | #330 | Tragic 39.2% |
| Immigrants | Congo | 0.0 /100 | #331 | Tragic 39.0% |
| Somalis | 0.0 /100 | #332 | Tragic 39.0% |
| Immigrants | West Indies | 0.0 /100 | #333 | Tragic 39.0% |
| Immigrants | St. Vincent and the Grenadines | 0.0 /100 | #334 | Tragic 38.7% |
Demographics Similar to Cambodians by Married-couple Households
In terms of married-couple households, the demographic groups most similar to Cambodians are Immigrants from South America (45.9%, a difference of 0.050%), Chickasaw (45.9%, a difference of 0.080%), Mexican American Indian (45.9%, a difference of 0.11%), Ottawa (45.8%, a difference of 0.11%), and Taiwanese (45.9%, a difference of 0.12%).
| Demographics | Rating | Rank | Married-couple Households |
| Immigrants | Kuwait | 25.6 /100 | #190 | Fair 46.0% |
| Choctaw | 24.9 /100 | #191 | Fair 46.0% |
| Immigrants | Northern Africa | 24.6 /100 | #192 | Fair 46.0% |
| Taiwanese | 23.4 /100 | #193 | Fair 45.9% |
| Mexican American Indians | 23.3 /100 | #194 | Fair 45.9% |
| Chickasaw | 22.7 /100 | #195 | Fair 45.9% |
| Immigrants | South America | 22.2 /100 | #196 | Fair 45.9% |
| Cambodians | 21.3 /100 | #197 | Fair 45.9% |
| Ottawa | 19.4 /100 | #198 | Poor 45.8% |
| Carpatho Rusyns | 15.7 /100 | #199 | Poor 45.7% |
| Potawatomi | 15.6 /100 | #200 | Poor 45.7% |
| Immigrants | Serbia | 15.2 /100 | #201 | Poor 45.7% |
| Immigrants | Central America | 14.2 /100 | #202 | Poor 45.7% |
| Alaska Natives | 13.0 /100 | #203 | Poor 45.6% |
| Aleuts | 12.5 /100 | #204 | Poor 45.6% |