Lumbee vs Subsaharan African College, 1 year or more
COMPARE
Lumbee
Subsaharan African
College, 1 year or more
College, 1 year or more Comparison
Lumbee
Sub-Saharan Africans
48.9%
COLLEGE, 1 YEAR OR MORE
0.0/ 100
METRIC RATING
334th/ 347
METRIC RANK
57.3%
COLLEGE, 1 YEAR OR MORE
6.1/ 100
METRIC RATING
222nd/ 347
METRIC RANK
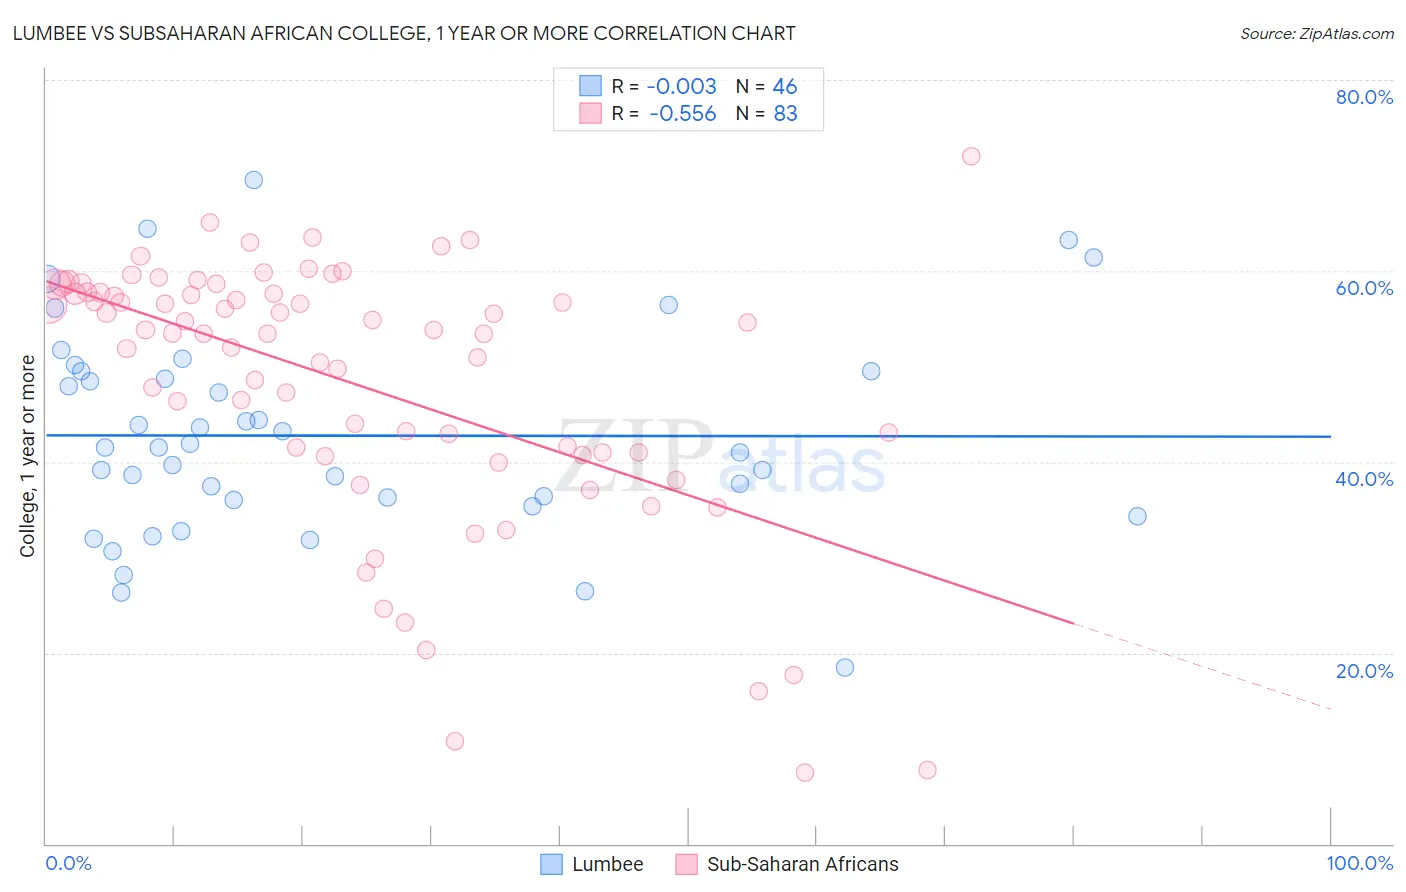
Lumbee vs Subsaharan African College, 1 year or more Correlation Chart
The statistical analysis conducted on geographies consisting of 92,299,068 people shows no correlation between the proportion of Lumbee and percentage of population with at least college, 1 year or more education in the United States with a correlation coefficient (R) of -0.003 and weighted average of 48.9%. Similarly, the statistical analysis conducted on geographies consisting of 508,212,148 people shows a substantial negative correlation between the proportion of Sub-Saharan Africans and percentage of population with at least college, 1 year or more education in the United States with a correlation coefficient (R) of -0.556 and weighted average of 57.3%, a difference of 17.2%.
College, 1 year or more Correlation Summary
| Measurement | Lumbee | Subsaharan African |
| Minimum | 18.5% | 7.4% |
| Maximum | 69.5% | 72.0% |
| Range | 51.0% | 64.6% |
| Mean | 42.8% | 48.2% |
| Median | 41.5% | 53.5% |
| Interquartile 25% (IQ1) | 36.0% | 40.9% |
| Interquartile 75% (IQ3) | 49.4% | 57.8% |
| Interquartile Range (IQR) | 13.4% | 16.8% |
| Standard Deviation (Sample) | 10.9% | 14.0% |
| Standard Deviation (Population) | 10.8% | 13.9% |
Similar Demographics by College, 1 year or more
Demographics Similar to Lumbee by College, 1 year or more
In terms of college, 1 year or more, the demographic groups most similar to Lumbee are Yuman (48.7%, a difference of 0.28%), Immigrants from Dominican Republic (49.1%, a difference of 0.58%), Spanish American Indian (48.5%, a difference of 0.72%), Pennsylvania German (48.5%, a difference of 0.73%), and Mexican (49.2%, a difference of 0.75%).
| Demographics | Rating | Rank | College, 1 year or more |
| Menominee | 0.0 /100 | #327 | Tragic 50.6% |
| Dutch West Indians | 0.0 /100 | #328 | Tragic 50.5% |
| Cape Verdeans | 0.0 /100 | #329 | Tragic 50.3% |
| Natives/Alaskans | 0.0 /100 | #330 | Tragic 50.2% |
| Immigrants | Yemen | 0.0 /100 | #331 | Tragic 50.0% |
| Mexicans | 0.0 /100 | #332 | Tragic 49.2% |
| Immigrants | Dominican Republic | 0.0 /100 | #333 | Tragic 49.1% |
| Lumbee | 0.0 /100 | #334 | Tragic 48.9% |
| Yuman | 0.0 /100 | #335 | Tragic 48.7% |
| Spanish American Indians | 0.0 /100 | #336 | Tragic 48.5% |
| Pennsylvania Germans | 0.0 /100 | #337 | Tragic 48.5% |
| Immigrants | Central America | 0.0 /100 | #338 | Tragic 48.5% |
| Immigrants | Azores | 0.0 /100 | #339 | Tragic 48.4% |
| Immigrants | Cabo Verde | 0.0 /100 | #340 | Tragic 48.1% |
| Immigrants | Mexico | 0.0 /100 | #341 | Tragic 47.5% |
Demographics Similar to Sub-Saharan Africans by College, 1 year or more
In terms of college, 1 year or more, the demographic groups most similar to Sub-Saharan Africans are Portuguese (57.2%, a difference of 0.17%), Hmong (57.2%, a difference of 0.17%), Immigrants from Ghana (57.4%, a difference of 0.34%), Vietnamese (57.0%, a difference of 0.38%), and Immigrants from Western Africa (57.0%, a difference of 0.40%).
| Demographics | Rating | Rank | College, 1 year or more |
| Tongans | 11.6 /100 | #215 | Poor 57.8% |
| Immigrants | Peru | 10.6 /100 | #216 | Poor 57.7% |
| Immigrants | Panama | 9.1 /100 | #217 | Tragic 57.6% |
| Native Hawaiians | 9.0 /100 | #218 | Tragic 57.6% |
| Whites/Caucasians | 8.7 /100 | #219 | Tragic 57.6% |
| Immigrants | Costa Rica | 8.0 /100 | #220 | Tragic 57.5% |
| Immigrants | Ghana | 7.7 /100 | #221 | Tragic 57.4% |
| Sub-Saharan Africans | 6.1 /100 | #222 | Tragic 57.3% |
| Portuguese | 5.4 /100 | #223 | Tragic 57.2% |
| Hmong | 5.4 /100 | #224 | Tragic 57.2% |
| Vietnamese | 4.7 /100 | #225 | Tragic 57.0% |
| Immigrants | Western Africa | 4.6 /100 | #226 | Tragic 57.0% |
| Immigrants | Immigrants | 4.4 /100 | #227 | Tragic 57.0% |
| Immigrants | Fiji | 4.0 /100 | #228 | Tragic 56.9% |
| Cree | 3.6 /100 | #229 | Tragic 56.8% |