Immigrants from Morocco vs Subsaharan African Married-couple Households
COMPARE
Immigrants from Morocco
Subsaharan African
Married-couple Households
Married-couple Households Comparison
Immigrants from Morocco
Sub-Saharan Africans
44.2%
MARRIED-COUPLE HOUSEHOLDS
0.6/ 100
METRIC RATING
247th/ 347
METRIC RANK
41.6%
MARRIED-COUPLE HOUSEHOLDS
0.0/ 100
METRIC RATING
303rd/ 347
METRIC RANK
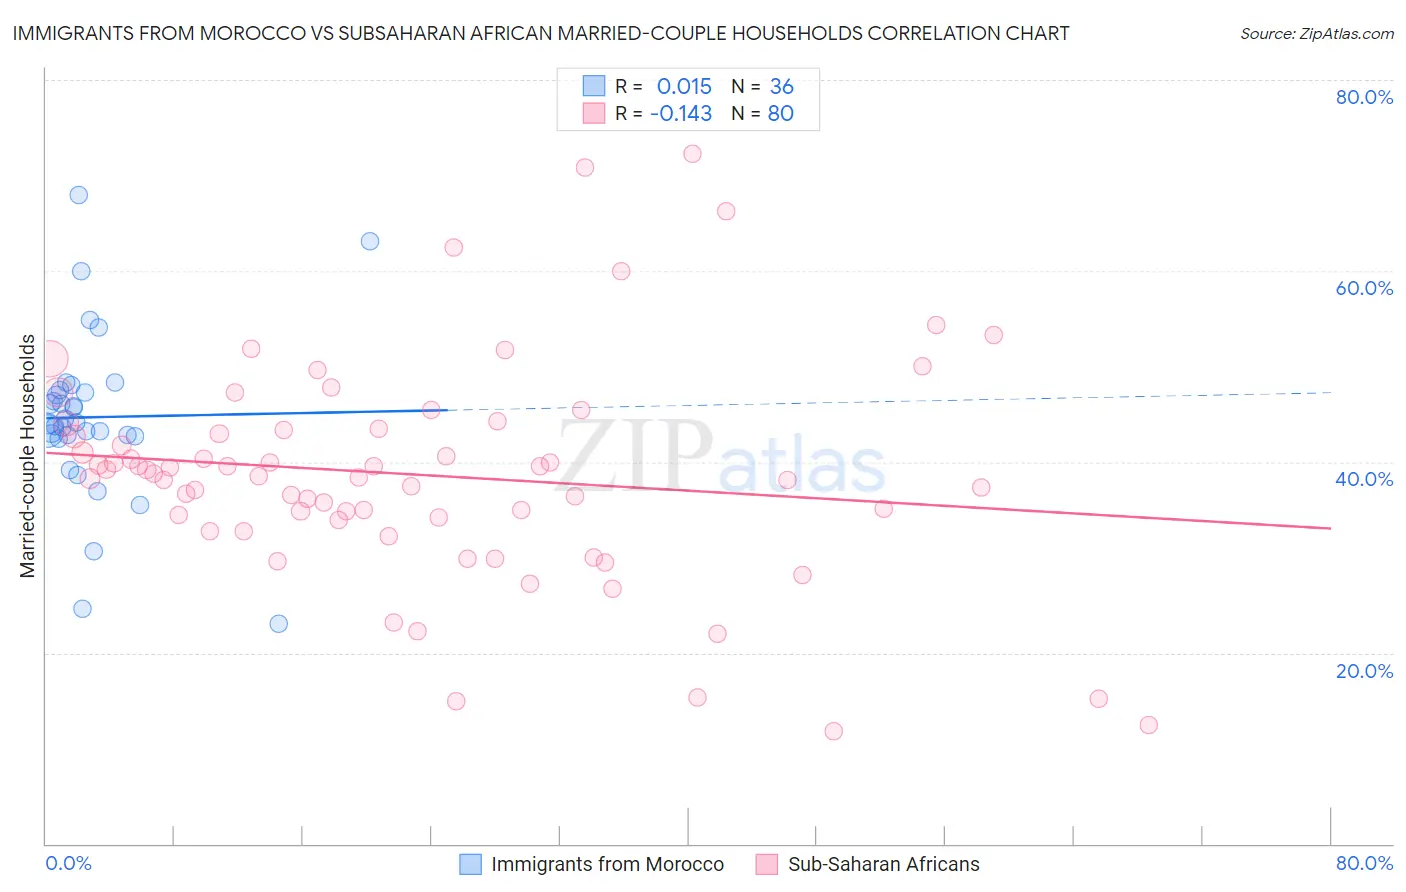
Immigrants from Morocco vs Subsaharan African Married-couple Households Correlation Chart
The statistical analysis conducted on geographies consisting of 178,909,382 people shows no correlation between the proportion of Immigrants from Morocco and percentage of married-couple family households in the United States with a correlation coefficient (R) of 0.015 and weighted average of 44.2%. Similarly, the statistical analysis conducted on geographies consisting of 507,572,233 people shows a poor negative correlation between the proportion of Sub-Saharan Africans and percentage of married-couple family households in the United States with a correlation coefficient (R) of -0.143 and weighted average of 41.6%, a difference of 6.2%.
Married-couple Households Correlation Summary
| Measurement | Immigrants from Morocco | Subsaharan African |
| Minimum | 23.0% | 11.8% |
| Maximum | 68.0% | 72.3% |
| Range | 44.9% | 60.5% |
| Mean | 44.7% | 38.7% |
| Median | 44.1% | 38.6% |
| Interquartile 25% (IQ1) | 42.7% | 34.1% |
| Interquartile 75% (IQ3) | 47.4% | 43.4% |
| Interquartile Range (IQR) | 4.7% | 9.3% |
| Standard Deviation (Sample) | 8.8% | 11.6% |
| Standard Deviation (Population) | 8.6% | 11.5% |
Similar Demographics by Married-couple Households
Demographics Similar to Immigrants from Morocco by Married-couple Households
In terms of married-couple households, the demographic groups most similar to Immigrants from Morocco are Immigrants from Cuba (44.2%, a difference of 0.0%), Immigrants from El Salvador (44.3%, a difference of 0.15%), Immigrants from Armenia (44.3%, a difference of 0.16%), Yup'ik (44.1%, a difference of 0.28%), and Immigrants from Kenya (44.1%, a difference of 0.32%).
| Demographics | Rating | Rank | Married-couple Households |
| Ute | 1.0 /100 | #240 | Tragic 44.4% |
| Immigrants | Bosnia and Herzegovina | 1.0 /100 | #241 | Tragic 44.4% |
| Immigrants | Albania | 1.0 /100 | #242 | Tragic 44.4% |
| Immigrants | Saudi Arabia | 0.9 /100 | #243 | Tragic 44.4% |
| Immigrants | Armenia | 0.7 /100 | #244 | Tragic 44.3% |
| Immigrants | El Salvador | 0.7 /100 | #245 | Tragic 44.3% |
| Immigrants | Cuba | 0.6 /100 | #246 | Tragic 44.2% |
| Immigrants | Morocco | 0.6 /100 | #247 | Tragic 44.2% |
| Yup'ik | 0.4 /100 | #248 | Tragic 44.1% |
| Immigrants | Kenya | 0.4 /100 | #249 | Tragic 44.1% |
| French American Indians | 0.4 /100 | #250 | Tragic 44.1% |
| German Russians | 0.4 /100 | #251 | Tragic 44.0% |
| Seminole | 0.4 /100 | #252 | Tragic 44.0% |
| Central Americans | 0.3 /100 | #253 | Tragic 43.9% |
| Apache | 0.3 /100 | #254 | Tragic 43.9% |
Demographics Similar to Sub-Saharan Africans by Married-couple Households
In terms of married-couple households, the demographic groups most similar to Sub-Saharan Africans are Immigrants from Honduras (41.6%, a difference of 0.0%), Immigrants from Guyana (41.6%, a difference of 0.11%), Immigrants from Bahamas (41.7%, a difference of 0.18%), Sioux (41.5%, a difference of 0.22%), and Immigrants from Belize (41.8%, a difference of 0.39%).
| Demographics | Rating | Rank | Married-couple Households |
| Immigrants | Sudan | 0.0 /100 | #296 | Tragic 41.9% |
| Arapaho | 0.0 /100 | #297 | Tragic 41.8% |
| Immigrants | Middle Africa | 0.0 /100 | #298 | Tragic 41.8% |
| Immigrants | Ghana | 0.0 /100 | #299 | Tragic 41.8% |
| Immigrants | Belize | 0.0 /100 | #300 | Tragic 41.8% |
| Immigrants | Bahamas | 0.0 /100 | #301 | Tragic 41.7% |
| Immigrants | Honduras | 0.0 /100 | #302 | Tragic 41.6% |
| Sub-Saharan Africans | 0.0 /100 | #303 | Tragic 41.6% |
| Immigrants | Guyana | 0.0 /100 | #304 | Tragic 41.6% |
| Sioux | 0.0 /100 | #305 | Tragic 41.5% |
| Guyanese | 0.0 /100 | #306 | Tragic 41.4% |
| Immigrants | Western Africa | 0.0 /100 | #307 | Tragic 41.4% |
| Crow | 0.0 /100 | #308 | Tragic 41.4% |
| Immigrants | Trinidad and Tobago | 0.0 /100 | #309 | Tragic 41.2% |
| Haitians | 0.0 /100 | #310 | Tragic 41.2% |