Immigrants from Austria vs White/Caucasian Births to Unmarried Women
COMPARE
Immigrants from Austria
White/Caucasian
Births to Unmarried Women
Births to Unmarried Women Comparison
Immigrants from Austria
Whites/Caucasians
28.7%
BIRTHS TO UNMARRIED WOMEN
98.1/ 100
METRIC RATING
81st/ 347
METRIC RANK
33.3%
BIRTHS TO UNMARRIED WOMEN
10.7/ 100
METRIC RATING
209th/ 347
METRIC RANK
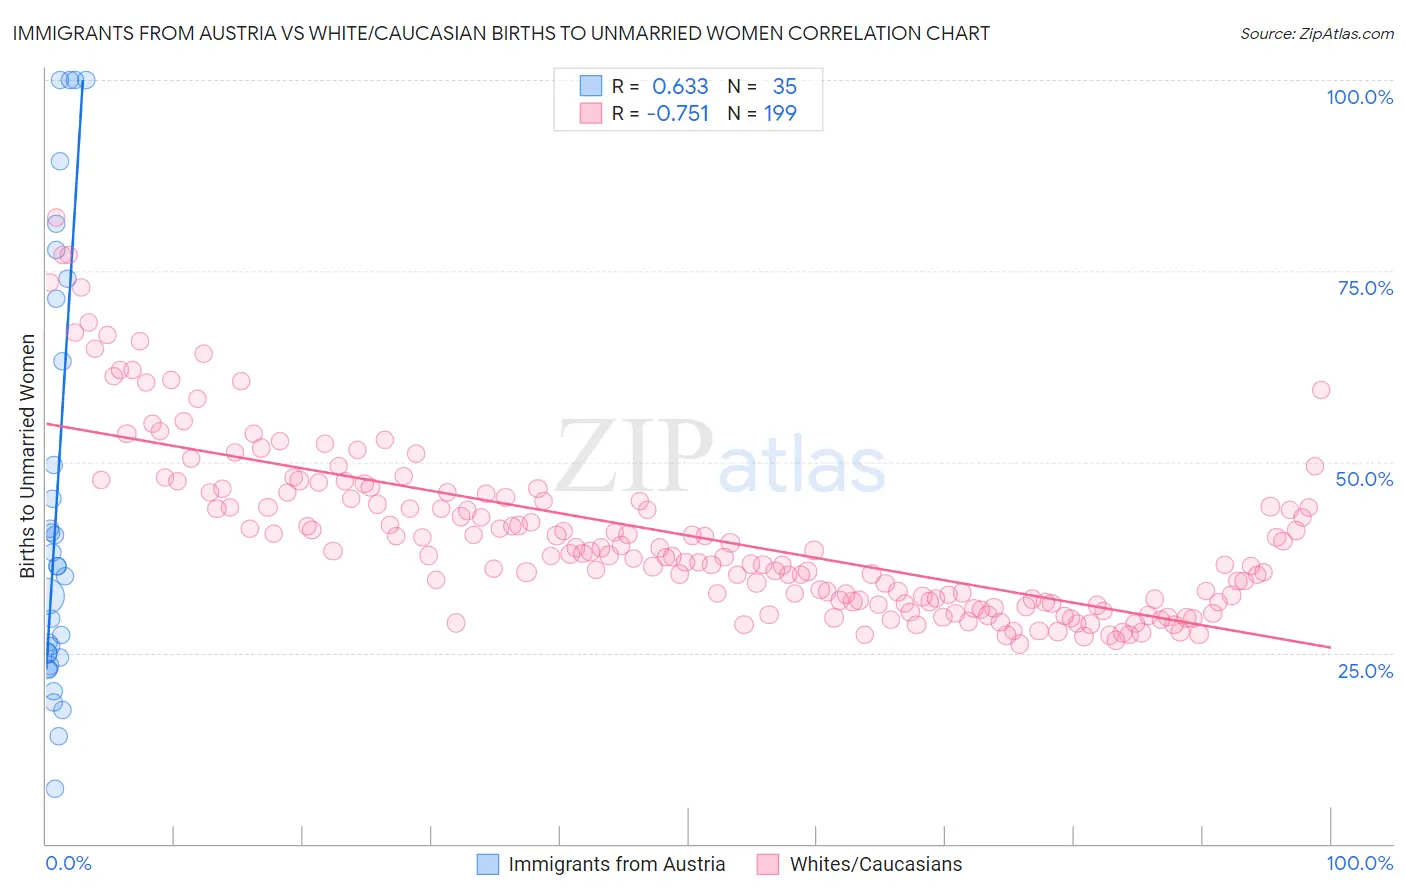
Immigrants from Austria vs White/Caucasian Births to Unmarried Women Correlation Chart
The statistical analysis conducted on geographies consisting of 159,179,999 people shows a significant positive correlation between the proportion of Immigrants from Austria and percentage of births to unmarried women in the United States with a correlation coefficient (R) of 0.633 and weighted average of 28.7%. Similarly, the statistical analysis conducted on geographies consisting of 513,410,964 people shows a strong negative correlation between the proportion of Whites/Caucasians and percentage of births to unmarried women in the United States with a correlation coefficient (R) of -0.751 and weighted average of 33.3%, a difference of 15.8%.
Births to Unmarried Women Correlation Summary
| Measurement | Immigrants from Austria | White/Caucasian |
| Minimum | 7.2% | 26.1% |
| Maximum | 100.0% | 82.1% |
| Range | 92.8% | 56.0% |
| Mean | 45.2% | 40.4% |
| Median | 36.4% | 37.8% |
| Interquartile 25% (IQ1) | 24.4% | 31.7% |
| Interquartile 75% (IQ3) | 71.3% | 45.8% |
| Interquartile Range (IQR) | 46.9% | 14.1% |
| Standard Deviation (Sample) | 28.3% | 11.2% |
| Standard Deviation (Population) | 27.9% | 11.2% |
Similar Demographics by Births to Unmarried Women
Demographics Similar to Immigrants from Austria by Births to Unmarried Women
In terms of births to unmarried women, the demographic groups most similar to Immigrants from Austria are Immigrants from Afghanistan (28.7%, a difference of 0.040%), Danish (28.7%, a difference of 0.070%), Zimbabwean (28.7%, a difference of 0.090%), Romanian (28.7%, a difference of 0.11%), and Immigrants from Kuwait (28.8%, a difference of 0.18%).
| Demographics | Rating | Rank | Births to Unmarried Women |
| Immigrants | Bolivia | 98.5 /100 | #74 | Exceptional 28.6% |
| Immigrants | Switzerland | 98.4 /100 | #75 | Exceptional 28.6% |
| Israelis | 98.4 /100 | #76 | Exceptional 28.6% |
| Immigrants | Northern Europe | 98.3 /100 | #77 | Exceptional 28.6% |
| Zimbabweans | 98.2 /100 | #78 | Exceptional 28.7% |
| Danes | 98.2 /100 | #79 | Exceptional 28.7% |
| Immigrants | Afghanistan | 98.1 /100 | #80 | Exceptional 28.7% |
| Immigrants | Austria | 98.1 /100 | #81 | Exceptional 28.7% |
| Romanians | 98.0 /100 | #82 | Exceptional 28.7% |
| Immigrants | Kuwait | 98.0 /100 | #83 | Exceptional 28.8% |
| Immigrants | Poland | 97.6 /100 | #84 | Exceptional 28.9% |
| Sri Lankans | 97.5 /100 | #85 | Exceptional 28.9% |
| Immigrants | Jordan | 97.4 /100 | #86 | Exceptional 29.0% |
| Taiwanese | 97.3 /100 | #87 | Exceptional 29.0% |
| Immigrants | France | 97.3 /100 | #88 | Exceptional 29.0% |
Demographics Similar to Whites/Caucasians by Births to Unmarried Women
In terms of births to unmarried women, the demographic groups most similar to Whites/Caucasians are Scotch-Irish (33.3%, a difference of 0.0%), Ecuadorian (33.3%, a difference of 0.050%), Celtic (33.3%, a difference of 0.12%), Hawaiian (33.2%, a difference of 0.14%), and Immigrants from Sudan (33.2%, a difference of 0.17%).
| Demographics | Rating | Rank | Births to Unmarried Women |
| Immigrants | Micronesia | 16.6 /100 | #202 | Poor 32.9% |
| Ute | 14.4 /100 | #203 | Poor 33.0% |
| Immigrants | Africa | 14.3 /100 | #204 | Poor 33.0% |
| German Russians | 13.1 /100 | #205 | Poor 33.1% |
| Uruguayans | 12.8 /100 | #206 | Poor 33.1% |
| Immigrants | Sudan | 11.5 /100 | #207 | Poor 33.2% |
| Hawaiians | 11.3 /100 | #208 | Poor 33.2% |
| Whites/Caucasians | 10.7 /100 | #209 | Poor 33.3% |
| Scotch-Irish | 10.7 /100 | #210 | Poor 33.3% |
| Ecuadorians | 10.5 /100 | #211 | Poor 33.3% |
| Celtics | 10.2 /100 | #212 | Poor 33.3% |
| Immigrants | Costa Rica | 9.5 /100 | #213 | Tragic 33.4% |
| Slovaks | 9.3 /100 | #214 | Tragic 33.4% |
| French | 8.7 /100 | #215 | Tragic 33.4% |
| Nepalese | 7.8 /100 | #216 | Tragic 33.5% |