Immigrants from Austria vs White/Caucasian Female Disability
COMPARE
Immigrants from Austria
White/Caucasian
Female Disability
Female Disability Comparison
Immigrants from Austria
Whites/Caucasians
12.0%
FEMALE DISABILITY
87.9/ 100
METRIC RATING
144th/ 347
METRIC RANK
13.2%
FEMALE DISABILITY
0.0/ 100
METRIC RATING
288th/ 347
METRIC RANK
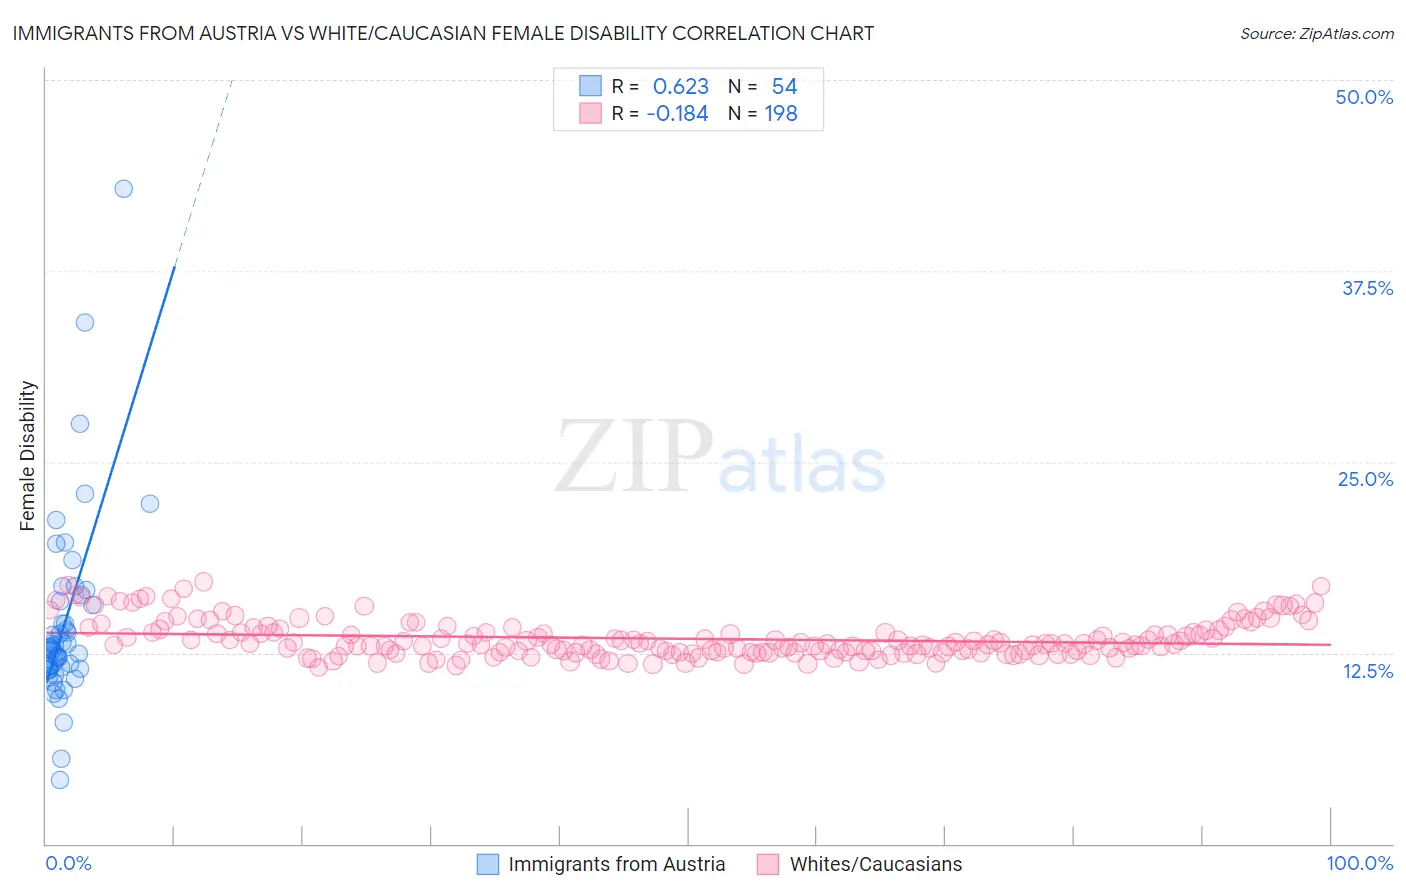
Immigrants from Austria vs White/Caucasian Female Disability Correlation Chart
The statistical analysis conducted on geographies consisting of 167,970,521 people shows a significant positive correlation between the proportion of Immigrants from Austria and percentage of females with a disability in the United States with a correlation coefficient (R) of 0.623 and weighted average of 12.0%. Similarly, the statistical analysis conducted on geographies consisting of 582,775,170 people shows a poor negative correlation between the proportion of Whites/Caucasians and percentage of females with a disability in the United States with a correlation coefficient (R) of -0.184 and weighted average of 13.2%, a difference of 10.2%.
Female Disability Correlation Summary
| Measurement | Immigrants from Austria | White/Caucasian |
| Minimum | 4.2% | 11.5% |
| Maximum | 42.9% | 17.2% |
| Range | 38.7% | 5.6% |
| Mean | 14.5% | 13.4% |
| Median | 12.8% | 13.1% |
| Interquartile 25% (IQ1) | 11.5% | 12.5% |
| Interquartile 75% (IQ3) | 15.9% | 14.0% |
| Interquartile Range (IQR) | 4.4% | 1.5% |
| Standard Deviation (Sample) | 6.3% | 1.2% |
| Standard Deviation (Population) | 6.3% | 1.2% |
Similar Demographics by Female Disability
Demographics Similar to Immigrants from Austria by Female Disability
In terms of female disability, the demographic groups most similar to Immigrants from Austria are Estonian (12.0%, a difference of 0.0%), Immigrants from Sudan (11.9%, a difference of 0.17%), Immigrants from Africa (11.9%, a difference of 0.21%), Pakistani (12.0%, a difference of 0.27%), and Nigerian (12.0%, a difference of 0.30%).
| Demographics | Rating | Rank | Female Disability |
| Immigrants | Norway | 93.8 /100 | #137 | Exceptional 11.9% |
| Ecuadorians | 93.4 /100 | #138 | Exceptional 11.9% |
| Immigrants | Hungary | 92.8 /100 | #139 | Exceptional 11.9% |
| Romanians | 91.6 /100 | #140 | Exceptional 11.9% |
| Immigrants | Ecuador | 91.5 /100 | #141 | Exceptional 11.9% |
| Immigrants | Africa | 90.0 /100 | #142 | Excellent 11.9% |
| Immigrants | Sudan | 89.6 /100 | #143 | Excellent 11.9% |
| Immigrants | Austria | 87.9 /100 | #144 | Excellent 12.0% |
| Estonians | 87.8 /100 | #145 | Excellent 12.0% |
| Pakistanis | 84.6 /100 | #146 | Excellent 12.0% |
| Nigerians | 84.0 /100 | #147 | Excellent 12.0% |
| Immigrants | Kenya | 83.1 /100 | #148 | Excellent 12.0% |
| Greeks | 82.0 /100 | #149 | Excellent 12.0% |
| Immigrants | Moldova | 81.4 /100 | #150 | Excellent 12.0% |
| Icelanders | 80.7 /100 | #151 | Excellent 12.0% |
Demographics Similar to Whites/Caucasians by Female Disability
In terms of female disability, the demographic groups most similar to Whites/Caucasians are Yaqui (13.2%, a difference of 0.10%), Tlingit-Haida (13.2%, a difference of 0.17%), Immigrants from Yemen (13.2%, a difference of 0.18%), Shoshone (13.2%, a difference of 0.24%), and Yakama (13.2%, a difference of 0.40%).
| Demographics | Rating | Rank | Female Disability |
| U.S. Virgin Islanders | 0.1 /100 | #281 | Tragic 13.1% |
| Welsh | 0.0 /100 | #282 | Tragic 13.1% |
| English | 0.0 /100 | #283 | Tragic 13.1% |
| Hmong | 0.0 /100 | #284 | Tragic 13.1% |
| Bangladeshis | 0.0 /100 | #285 | Tragic 13.1% |
| Fijians | 0.0 /100 | #286 | Tragic 13.1% |
| Yaqui | 0.0 /100 | #287 | Tragic 13.2% |
| Whites/Caucasians | 0.0 /100 | #288 | Tragic 13.2% |
| Tlingit-Haida | 0.0 /100 | #289 | Tragic 13.2% |
| Immigrants | Yemen | 0.0 /100 | #290 | Tragic 13.2% |
| Shoshone | 0.0 /100 | #291 | Tragic 13.2% |
| Yakama | 0.0 /100 | #292 | Tragic 13.2% |
| Marshallese | 0.0 /100 | #293 | Tragic 13.3% |
| Celtics | 0.0 /100 | #294 | Tragic 13.3% |
| French | 0.0 /100 | #295 | Tragic 13.3% |