Immigrants from Croatia vs White/Caucasian Births to Unmarried Women
COMPARE
Immigrants from Croatia
White/Caucasian
Births to Unmarried Women
Births to Unmarried Women Comparison
Immigrants from Croatia
Whites/Caucasians
29.8%
BIRTHS TO UNMARRIED WOMEN
92.6/ 100
METRIC RATING
114th/ 347
METRIC RANK
33.3%
BIRTHS TO UNMARRIED WOMEN
10.7/ 100
METRIC RATING
209th/ 347
METRIC RANK
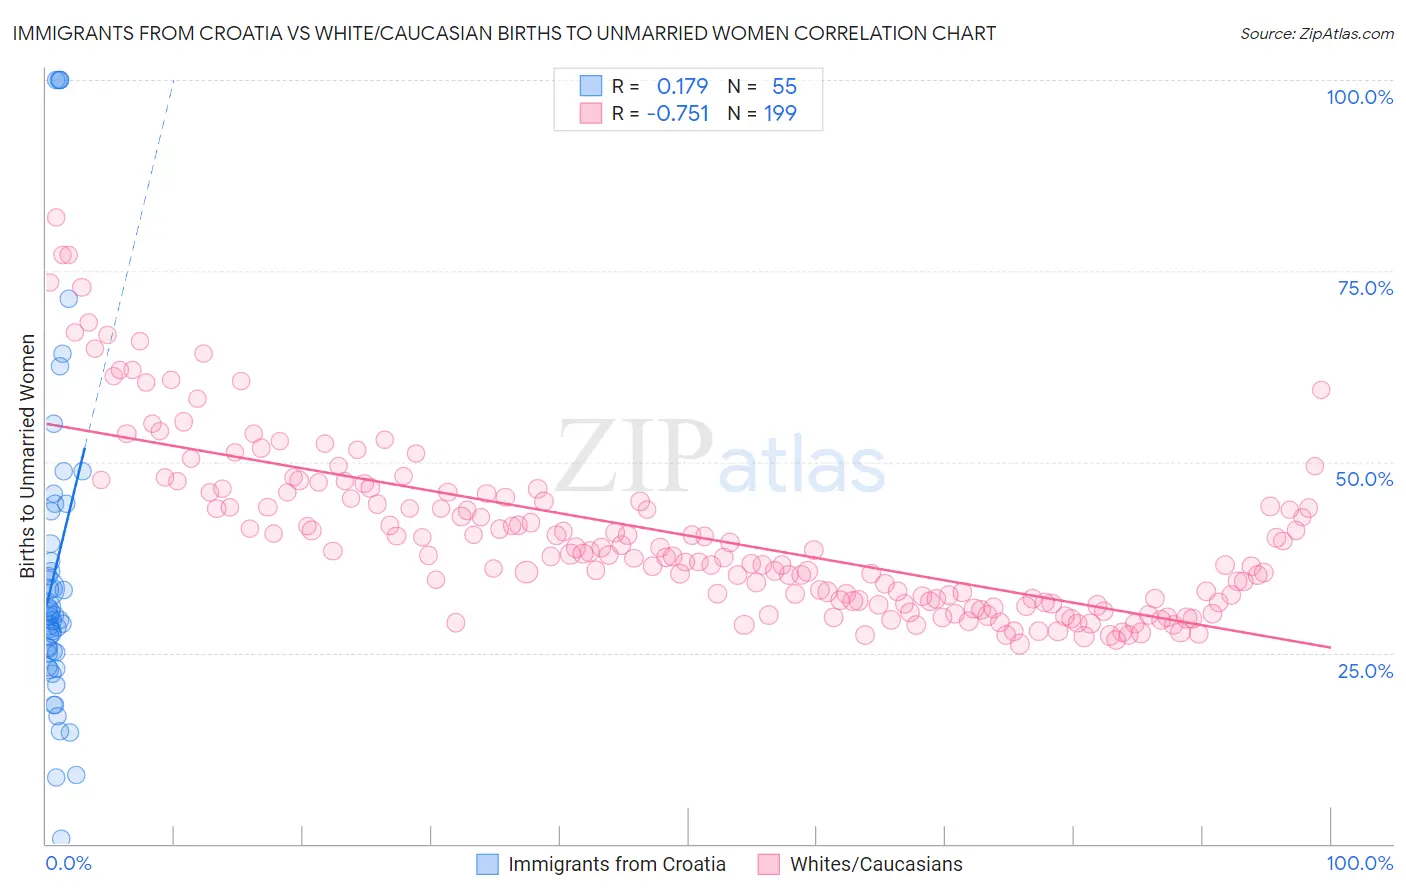
Immigrants from Croatia vs White/Caucasian Births to Unmarried Women Correlation Chart
The statistical analysis conducted on geographies consisting of 127,059,948 people shows a poor positive correlation between the proportion of Immigrants from Croatia and percentage of births to unmarried women in the United States with a correlation coefficient (R) of 0.179 and weighted average of 29.8%. Similarly, the statistical analysis conducted on geographies consisting of 513,410,964 people shows a strong negative correlation between the proportion of Whites/Caucasians and percentage of births to unmarried women in the United States with a correlation coefficient (R) of -0.751 and weighted average of 33.3%, a difference of 11.7%.
Births to Unmarried Women Correlation Summary
| Measurement | Immigrants from Croatia | White/Caucasian |
| Minimum | 0.70% | 26.1% |
| Maximum | 100.0% | 82.1% |
| Range | 99.3% | 56.0% |
| Mean | 36.1% | 40.4% |
| Median | 29.8% | 37.8% |
| Interquartile 25% (IQ1) | 24.9% | 31.7% |
| Interquartile 75% (IQ3) | 43.5% | 45.8% |
| Interquartile Range (IQR) | 18.6% | 14.1% |
| Standard Deviation (Sample) | 22.4% | 11.2% |
| Standard Deviation (Population) | 22.2% | 11.2% |
Similar Demographics by Births to Unmarried Women
Demographics Similar to Immigrants from Croatia by Births to Unmarried Women
In terms of births to unmarried women, the demographic groups most similar to Immigrants from Croatia are Scandinavian (29.8%, a difference of 0.060%), Basque (29.7%, a difference of 0.16%), Immigrants from Hungary (29.7%, a difference of 0.17%), Ethiopian (29.8%, a difference of 0.22%), and Immigrants from Italy (29.9%, a difference of 0.30%).
| Demographics | Rating | Rank | Births to Unmarried Women |
| Immigrants | Brazil | 93.7 /100 | #107 | Exceptional 29.6% |
| Paraguayans | 93.5 /100 | #108 | Exceptional 29.7% |
| Greeks | 93.4 /100 | #109 | Exceptional 29.7% |
| Immigrants | Ethiopia | 93.4 /100 | #110 | Exceptional 29.7% |
| Immigrants | Hungary | 93.0 /100 | #111 | Exceptional 29.7% |
| Basques | 93.0 /100 | #112 | Exceptional 29.7% |
| Scandinavians | 92.7 /100 | #113 | Exceptional 29.8% |
| Immigrants | Croatia | 92.6 /100 | #114 | Exceptional 29.8% |
| Ethiopians | 91.9 /100 | #115 | Exceptional 29.8% |
| Immigrants | Italy | 91.7 /100 | #116 | Exceptional 29.9% |
| Immigrants | Netherlands | 91.1 /100 | #117 | Exceptional 29.9% |
| Immigrants | Norway | 91.0 /100 | #118 | Exceptional 29.9% |
| Argentineans | 90.5 /100 | #119 | Exceptional 30.0% |
| Ugandans | 89.2 /100 | #120 | Excellent 30.1% |
| Koreans | 88.9 /100 | #121 | Excellent 30.1% |
Demographics Similar to Whites/Caucasians by Births to Unmarried Women
In terms of births to unmarried women, the demographic groups most similar to Whites/Caucasians are Scotch-Irish (33.3%, a difference of 0.0%), Ecuadorian (33.3%, a difference of 0.050%), Celtic (33.3%, a difference of 0.12%), Hawaiian (33.2%, a difference of 0.14%), and Immigrants from Sudan (33.2%, a difference of 0.17%).
| Demographics | Rating | Rank | Births to Unmarried Women |
| Immigrants | Micronesia | 16.6 /100 | #202 | Poor 32.9% |
| Ute | 14.4 /100 | #203 | Poor 33.0% |
| Immigrants | Africa | 14.3 /100 | #204 | Poor 33.0% |
| German Russians | 13.1 /100 | #205 | Poor 33.1% |
| Uruguayans | 12.8 /100 | #206 | Poor 33.1% |
| Immigrants | Sudan | 11.5 /100 | #207 | Poor 33.2% |
| Hawaiians | 11.3 /100 | #208 | Poor 33.2% |
| Whites/Caucasians | 10.7 /100 | #209 | Poor 33.3% |
| Scotch-Irish | 10.7 /100 | #210 | Poor 33.3% |
| Ecuadorians | 10.5 /100 | #211 | Poor 33.3% |
| Celtics | 10.2 /100 | #212 | Poor 33.3% |
| Immigrants | Costa Rica | 9.5 /100 | #213 | Tragic 33.4% |
| Slovaks | 9.3 /100 | #214 | Tragic 33.4% |
| French | 8.7 /100 | #215 | Tragic 33.4% |
| Nepalese | 7.8 /100 | #216 | Tragic 33.5% |