Sri Lankan vs White/Caucasian Births to Unmarried Women
COMPARE
Sri Lankan
White/Caucasian
Births to Unmarried Women
Births to Unmarried Women Comparison
Sri Lankans
Whites/Caucasians
28.9%
BIRTHS TO UNMARRIED WOMEN
97.5/ 100
METRIC RATING
85th/ 347
METRIC RANK
33.3%
BIRTHS TO UNMARRIED WOMEN
10.7/ 100
METRIC RATING
209th/ 347
METRIC RANK
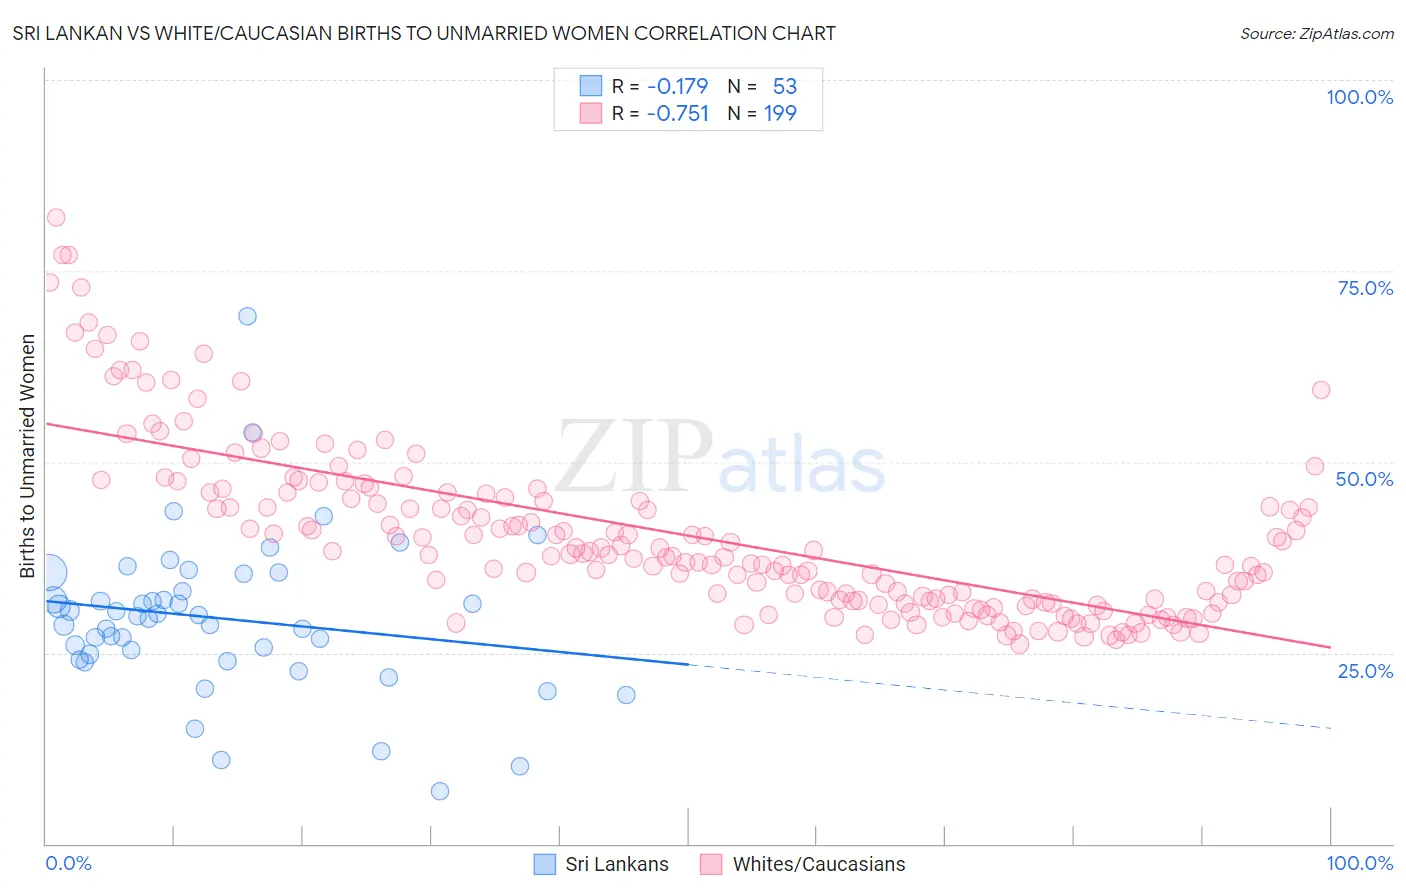
Sri Lankan vs White/Caucasian Births to Unmarried Women Correlation Chart
The statistical analysis conducted on geographies consisting of 411,137,985 people shows a poor negative correlation between the proportion of Sri Lankans and percentage of births to unmarried women in the United States with a correlation coefficient (R) of -0.179 and weighted average of 28.9%. Similarly, the statistical analysis conducted on geographies consisting of 513,410,964 people shows a strong negative correlation between the proportion of Whites/Caucasians and percentage of births to unmarried women in the United States with a correlation coefficient (R) of -0.751 and weighted average of 33.3%, a difference of 14.9%.
Births to Unmarried Women Correlation Summary
| Measurement | Sri Lankan | White/Caucasian |
| Minimum | 6.9% | 26.1% |
| Maximum | 69.0% | 82.1% |
| Range | 62.1% | 56.0% |
| Mean | 29.5% | 40.4% |
| Median | 29.7% | 37.8% |
| Interquartile 25% (IQ1) | 24.4% | 31.7% |
| Interquartile 75% (IQ3) | 34.2% | 45.8% |
| Interquartile Range (IQR) | 9.8% | 14.1% |
| Standard Deviation (Sample) | 10.2% | 11.2% |
| Standard Deviation (Population) | 10.1% | 11.2% |
Similar Demographics by Births to Unmarried Women
Demographics Similar to Sri Lankans by Births to Unmarried Women
In terms of births to unmarried women, the demographic groups most similar to Sri Lankans are Immigrants from Jordan (29.0%, a difference of 0.070%), Taiwanese (29.0%, a difference of 0.15%), Immigrants from France (29.0%, a difference of 0.16%), Immigrants from Poland (28.9%, a difference of 0.17%), and Immigrants from Saudi Arabia (29.1%, a difference of 0.43%).
| Demographics | Rating | Rank | Births to Unmarried Women |
| Zimbabweans | 98.2 /100 | #78 | Exceptional 28.7% |
| Danes | 98.2 /100 | #79 | Exceptional 28.7% |
| Immigrants | Afghanistan | 98.1 /100 | #80 | Exceptional 28.7% |
| Immigrants | Austria | 98.1 /100 | #81 | Exceptional 28.7% |
| Romanians | 98.0 /100 | #82 | Exceptional 28.7% |
| Immigrants | Kuwait | 98.0 /100 | #83 | Exceptional 28.8% |
| Immigrants | Poland | 97.6 /100 | #84 | Exceptional 28.9% |
| Sri Lankans | 97.5 /100 | #85 | Exceptional 28.9% |
| Immigrants | Jordan | 97.4 /100 | #86 | Exceptional 29.0% |
| Taiwanese | 97.3 /100 | #87 | Exceptional 29.0% |
| Immigrants | France | 97.3 /100 | #88 | Exceptional 29.0% |
| Immigrants | Saudi Arabia | 97.0 /100 | #89 | Exceptional 29.1% |
| Immigrants | Latvia | 96.8 /100 | #90 | Exceptional 29.1% |
| Immigrants | Fiji | 96.6 /100 | #91 | Exceptional 29.2% |
| Arabs | 96.5 /100 | #92 | Exceptional 29.2% |
Demographics Similar to Whites/Caucasians by Births to Unmarried Women
In terms of births to unmarried women, the demographic groups most similar to Whites/Caucasians are Scotch-Irish (33.3%, a difference of 0.0%), Ecuadorian (33.3%, a difference of 0.050%), Celtic (33.3%, a difference of 0.12%), Hawaiian (33.2%, a difference of 0.14%), and Immigrants from Sudan (33.2%, a difference of 0.17%).
| Demographics | Rating | Rank | Births to Unmarried Women |
| Immigrants | Micronesia | 16.6 /100 | #202 | Poor 32.9% |
| Ute | 14.4 /100 | #203 | Poor 33.0% |
| Immigrants | Africa | 14.3 /100 | #204 | Poor 33.0% |
| German Russians | 13.1 /100 | #205 | Poor 33.1% |
| Uruguayans | 12.8 /100 | #206 | Poor 33.1% |
| Immigrants | Sudan | 11.5 /100 | #207 | Poor 33.2% |
| Hawaiians | 11.3 /100 | #208 | Poor 33.2% |
| Whites/Caucasians | 10.7 /100 | #209 | Poor 33.3% |
| Scotch-Irish | 10.7 /100 | #210 | Poor 33.3% |
| Ecuadorians | 10.5 /100 | #211 | Poor 33.3% |
| Celtics | 10.2 /100 | #212 | Poor 33.3% |
| Immigrants | Costa Rica | 9.5 /100 | #213 | Tragic 33.4% |
| Slovaks | 9.3 /100 | #214 | Tragic 33.4% |
| French | 8.7 /100 | #215 | Tragic 33.4% |
| Nepalese | 7.8 /100 | #216 | Tragic 33.5% |