Immigrants from Austria vs White/Caucasian In Labor Force | Age 25-29
COMPARE
Immigrants from Austria
White/Caucasian
In Labor Force | Age 25-29
In Labor Force | Age 25-29 Comparison
Immigrants from Austria
Whites/Caucasians
85.0%
IN LABOR FORCE | AGE 25-29
91.9/ 100
METRIC RATING
108th/ 347
METRIC RANK
84.2%
IN LABOR FORCE | AGE 25-29
4.8/ 100
METRIC RATING
230th/ 347
METRIC RANK
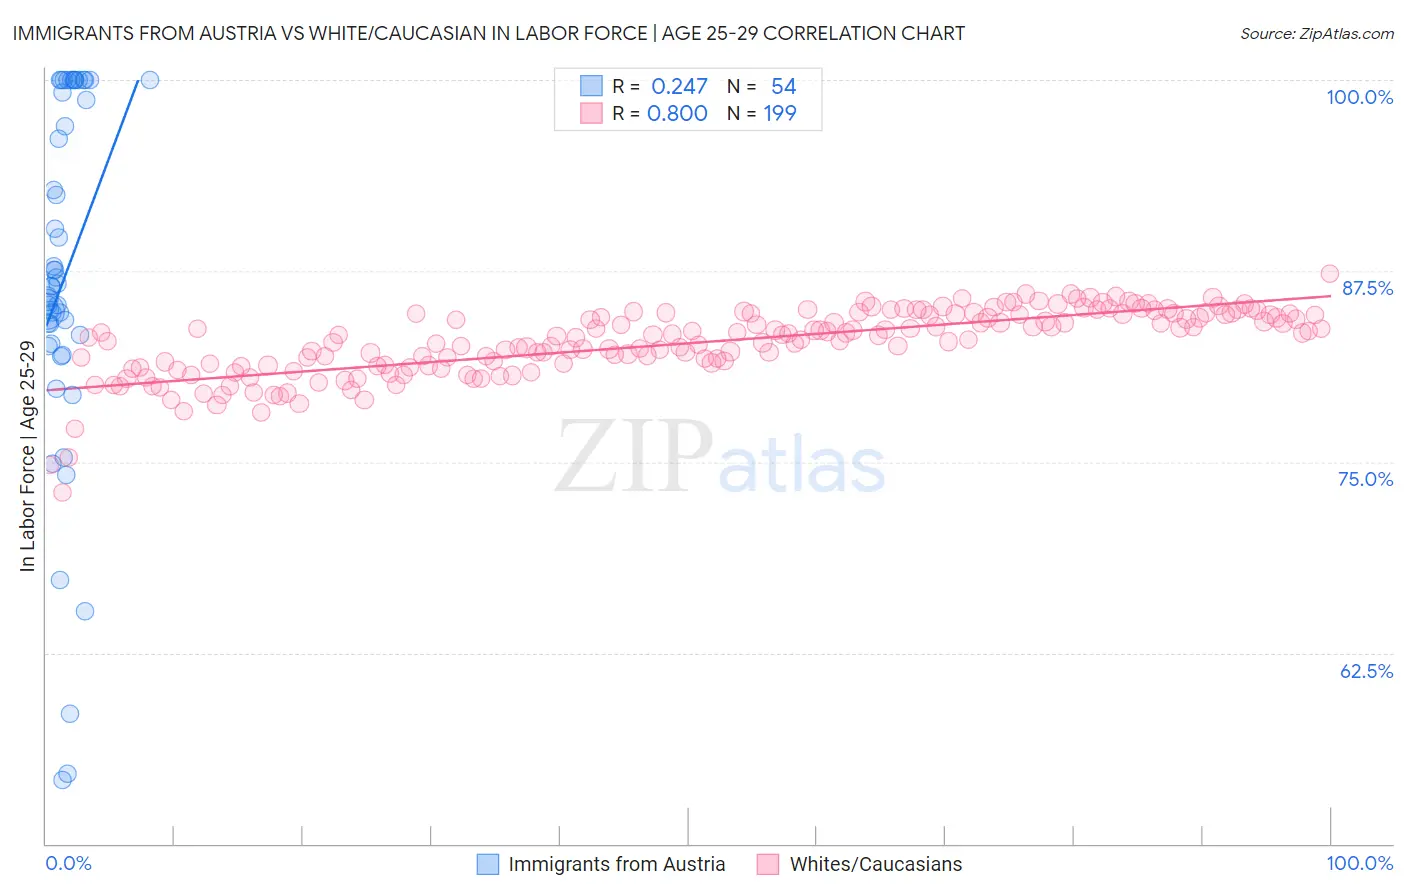
Immigrants from Austria vs White/Caucasian In Labor Force | Age 25-29 Correlation Chart
The statistical analysis conducted on geographies consisting of 167,922,363 people shows a weak positive correlation between the proportion of Immigrants from Austria and labor force participation rate among population between the ages 25 and 29 in the United States with a correlation coefficient (R) of 0.247 and weighted average of 85.0%. Similarly, the statistical analysis conducted on geographies consisting of 582,492,747 people shows a strong positive correlation between the proportion of Whites/Caucasians and labor force participation rate among population between the ages 25 and 29 in the United States with a correlation coefficient (R) of 0.800 and weighted average of 84.2%, a difference of 1.0%.
In Labor Force | Age 25-29 Correlation Summary
| Measurement | Immigrants from Austria | White/Caucasian |
| Minimum | 54.2% | 73.0% |
| Maximum | 100.0% | 87.3% |
| Range | 45.8% | 14.3% |
| Mean | 87.0% | 82.8% |
| Median | 86.5% | 83.2% |
| Interquartile 25% (IQ1) | 82.7% | 81.3% |
| Interquartile 75% (IQ3) | 99.2% | 84.6% |
| Interquartile Range (IQR) | 16.4% | 3.3% |
| Standard Deviation (Sample) | 11.7% | 2.2% |
| Standard Deviation (Population) | 11.6% | 2.2% |
Similar Demographics by In Labor Force | Age 25-29
Demographics Similar to Immigrants from Austria by In Labor Force | Age 25-29
In terms of in labor force | age 25-29, the demographic groups most similar to Immigrants from Austria are Costa Rican (85.0%, a difference of 0.0%), Immigrants from Southern Europe (85.0%, a difference of 0.010%), New Zealander (85.0%, a difference of 0.010%), Immigrants from Middle Africa (85.0%, a difference of 0.010%), and Immigrants from Hong Kong (85.0%, a difference of 0.020%).
| Demographics | Rating | Rank | In Labor Force | Age 25-29 |
| Egyptians | 93.8 /100 | #101 | Exceptional 85.1% |
| Slavs | 93.7 /100 | #102 | Exceptional 85.1% |
| Immigrants | Japan | 93.5 /100 | #103 | Exceptional 85.1% |
| Immigrants | Zaire | 93.3 /100 | #104 | Exceptional 85.1% |
| Immigrants | Hong Kong | 92.8 /100 | #105 | Exceptional 85.0% |
| Czechoslovakians | 92.6 /100 | #106 | Exceptional 85.0% |
| Immigrants | Southern Europe | 92.3 /100 | #107 | Exceptional 85.0% |
| Immigrants | Austria | 91.9 /100 | #108 | Exceptional 85.0% |
| Costa Ricans | 91.9 /100 | #109 | Exceptional 85.0% |
| New Zealanders | 91.5 /100 | #110 | Exceptional 85.0% |
| Immigrants | Middle Africa | 91.4 /100 | #111 | Exceptional 85.0% |
| Senegalese | 90.9 /100 | #112 | Exceptional 85.0% |
| Irish | 90.6 /100 | #113 | Exceptional 85.0% |
| Immigrants | Malaysia | 90.4 /100 | #114 | Exceptional 85.0% |
| South Africans | 88.9 /100 | #115 | Excellent 85.0% |
Demographics Similar to Whites/Caucasians by In Labor Force | Age 25-29
In terms of in labor force | age 25-29, the demographic groups most similar to Whites/Caucasians are Immigrants from Oceania (84.2%, a difference of 0.0%), Immigrants from Philippines (84.2%, a difference of 0.010%), Panamanian (84.2%, a difference of 0.010%), French American Indian (84.2%, a difference of 0.020%), and Immigrants from Panama (84.2%, a difference of 0.020%).
| Demographics | Rating | Rank | In Labor Force | Age 25-29 |
| Scotch-Irish | 6.5 /100 | #223 | Tragic 84.2% |
| Immigrants | West Indies | 6.0 /100 | #224 | Tragic 84.2% |
| Koreans | 5.9 /100 | #225 | Tragic 84.2% |
| Immigrants | Congo | 5.8 /100 | #226 | Tragic 84.2% |
| French American Indians | 5.5 /100 | #227 | Tragic 84.2% |
| Immigrants | Panama | 5.5 /100 | #228 | Tragic 84.2% |
| Immigrants | Oceania | 5.0 /100 | #229 | Tragic 84.2% |
| Whites/Caucasians | 4.8 /100 | #230 | Tragic 84.2% |
| Immigrants | Philippines | 4.7 /100 | #231 | Tragic 84.2% |
| Panamanians | 4.5 /100 | #232 | Tragic 84.2% |
| Immigrants | Western Asia | 2.7 /100 | #233 | Tragic 84.1% |
| Barbadians | 1.0 /100 | #234 | Tragic 83.9% |
| Iraqis | 0.9 /100 | #235 | Tragic 83.9% |
| Guamanians/Chamorros | 0.9 /100 | #236 | Tragic 83.9% |
| Immigrants | Immigrants | 0.9 /100 | #237 | Tragic 83.9% |