Immigrants from Austria vs Russian Births to Unmarried Women
COMPARE
Immigrants from Austria
Russian
Births to Unmarried Women
Births to Unmarried Women Comparison
Immigrants from Austria
Russians
28.7%
BIRTHS TO UNMARRIED WOMEN
98.1/ 100
METRIC RATING
81st/ 347
METRIC RANK
28.0%
BIRTHS TO UNMARRIED WOMEN
99.2/ 100
METRIC RATING
57th/ 347
METRIC RANK
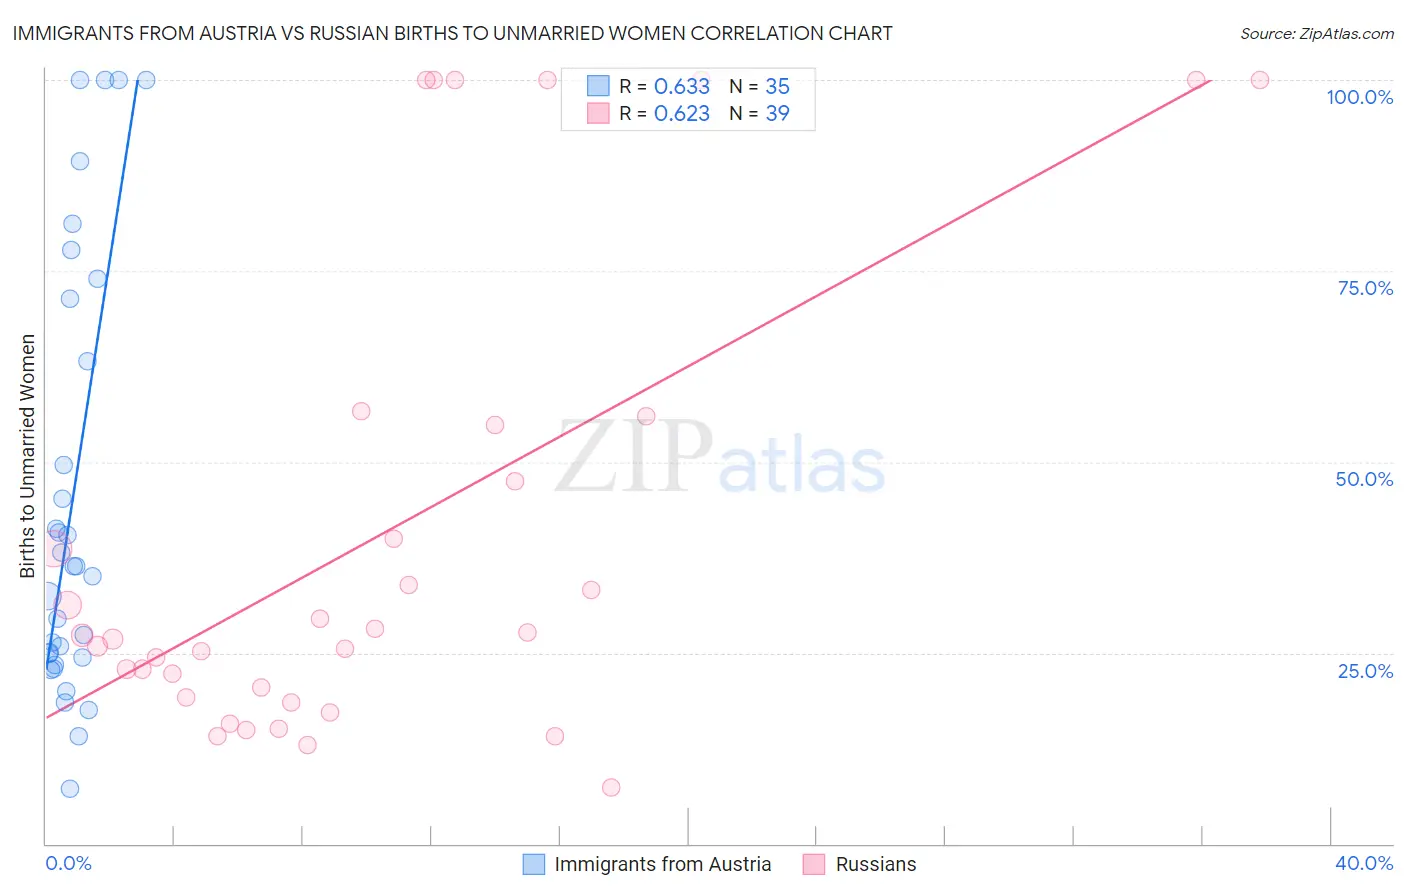
Immigrants from Austria vs Russian Births to Unmarried Women Correlation Chart
The statistical analysis conducted on geographies consisting of 159,179,999 people shows a significant positive correlation between the proportion of Immigrants from Austria and percentage of births to unmarried women in the United States with a correlation coefficient (R) of 0.633 and weighted average of 28.7%. Similarly, the statistical analysis conducted on geographies consisting of 462,642,937 people shows a significant positive correlation between the proportion of Russians and percentage of births to unmarried women in the United States with a correlation coefficient (R) of 0.623 and weighted average of 28.0%, a difference of 2.5%.
Births to Unmarried Women Correlation Summary
| Measurement | Immigrants from Austria | Russian |
| Minimum | 7.2% | 7.4% |
| Maximum | 100.0% | 100.0% |
| Range | 92.8% | 92.6% |
| Mean | 45.2% | 40.2% |
| Median | 36.4% | 27.3% |
| Interquartile 25% (IQ1) | 24.4% | 19.1% |
| Interquartile 75% (IQ3) | 71.3% | 54.9% |
| Interquartile Range (IQR) | 46.9% | 35.7% |
| Standard Deviation (Sample) | 28.3% | 30.6% |
| Standard Deviation (Population) | 27.9% | 30.2% |
Similar Demographics by Births to Unmarried Women
Demographics Similar to Immigrants from Austria by Births to Unmarried Women
In terms of births to unmarried women, the demographic groups most similar to Immigrants from Austria are Immigrants from Afghanistan (28.7%, a difference of 0.040%), Danish (28.7%, a difference of 0.070%), Zimbabwean (28.7%, a difference of 0.090%), Romanian (28.7%, a difference of 0.11%), and Immigrants from Kuwait (28.8%, a difference of 0.18%).
| Demographics | Rating | Rank | Births to Unmarried Women |
| Immigrants | Bolivia | 98.5 /100 | #74 | Exceptional 28.6% |
| Immigrants | Switzerland | 98.4 /100 | #75 | Exceptional 28.6% |
| Israelis | 98.4 /100 | #76 | Exceptional 28.6% |
| Immigrants | Northern Europe | 98.3 /100 | #77 | Exceptional 28.6% |
| Zimbabweans | 98.2 /100 | #78 | Exceptional 28.7% |
| Danes | 98.2 /100 | #79 | Exceptional 28.7% |
| Immigrants | Afghanistan | 98.1 /100 | #80 | Exceptional 28.7% |
| Immigrants | Austria | 98.1 /100 | #81 | Exceptional 28.7% |
| Romanians | 98.0 /100 | #82 | Exceptional 28.7% |
| Immigrants | Kuwait | 98.0 /100 | #83 | Exceptional 28.8% |
| Immigrants | Poland | 97.6 /100 | #84 | Exceptional 28.9% |
| Sri Lankans | 97.5 /100 | #85 | Exceptional 28.9% |
| Immigrants | Jordan | 97.4 /100 | #86 | Exceptional 29.0% |
| Taiwanese | 97.3 /100 | #87 | Exceptional 29.0% |
| Immigrants | France | 97.3 /100 | #88 | Exceptional 29.0% |
Demographics Similar to Russians by Births to Unmarried Women
In terms of births to unmarried women, the demographic groups most similar to Russians are Immigrants from Albania (28.0%, a difference of 0.11%), Immigrants from Belgium (28.0%, a difference of 0.13%), Immigrants from Kazakhstan (28.1%, a difference of 0.36%), Mongolian (27.9%, a difference of 0.39%), and Immigrants from Turkey (28.1%, a difference of 0.41%).
| Demographics | Rating | Rank | Births to Unmarried Women |
| Maltese | 99.4 /100 | #50 | Exceptional 27.8% |
| Macedonians | 99.4 /100 | #51 | Exceptional 27.9% |
| Bhutanese | 99.4 /100 | #52 | Exceptional 27.9% |
| Immigrants | Romania | 99.4 /100 | #53 | Exceptional 27.9% |
| Afghans | 99.4 /100 | #54 | Exceptional 27.9% |
| Mongolians | 99.3 /100 | #55 | Exceptional 27.9% |
| Immigrants | Belgium | 99.3 /100 | #56 | Exceptional 28.0% |
| Russians | 99.2 /100 | #57 | Exceptional 28.0% |
| Immigrants | Albania | 99.2 /100 | #58 | Exceptional 28.0% |
| Immigrants | Kazakhstan | 99.1 /100 | #59 | Exceptional 28.1% |
| Immigrants | Turkey | 99.1 /100 | #60 | Exceptional 28.1% |
| Immigrants | North Macedonia | 99.1 /100 | #61 | Exceptional 28.1% |
| Egyptians | 99.0 /100 | #62 | Exceptional 28.2% |
| Immigrants | Serbia | 98.9 /100 | #63 | Exceptional 28.3% |
| Tongans | 98.8 /100 | #64 | Exceptional 28.4% |