Immigrants from Austria vs Austrian Births to Unmarried Women
COMPARE
Immigrants from Austria
Austrian
Births to Unmarried Women
Births to Unmarried Women Comparison
Immigrants from Austria
Austrians
28.7%
BIRTHS TO UNMARRIED WOMEN
98.1/ 100
METRIC RATING
81st/ 347
METRIC RANK
31.0%
BIRTHS TO UNMARRIED WOMEN
69.9/ 100
METRIC RATING
158th/ 347
METRIC RANK
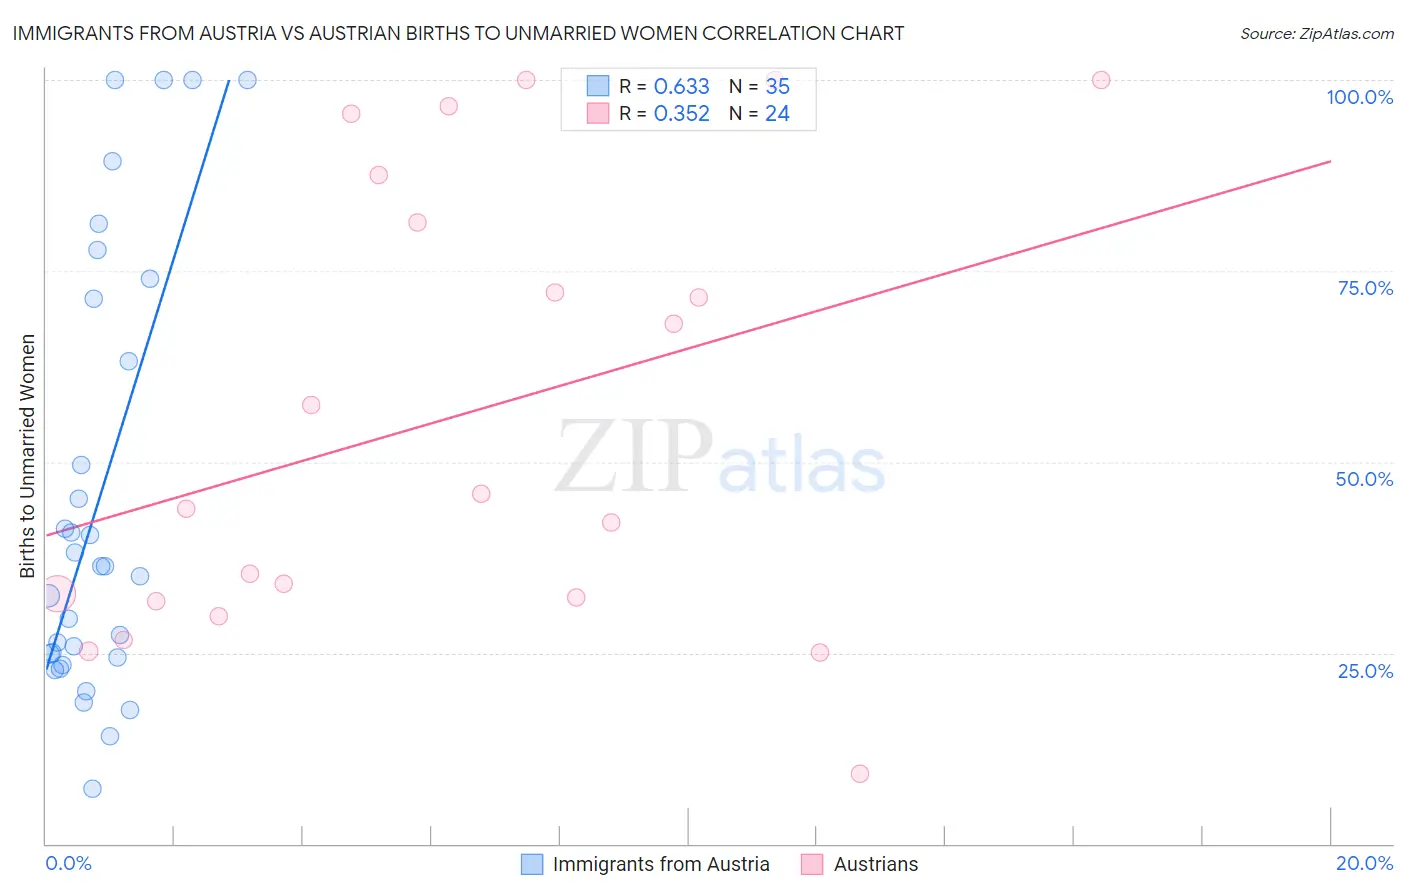
Immigrants from Austria vs Austrian Births to Unmarried Women Correlation Chart
The statistical analysis conducted on geographies consisting of 159,179,999 people shows a significant positive correlation between the proportion of Immigrants from Austria and percentage of births to unmarried women in the United States with a correlation coefficient (R) of 0.633 and weighted average of 28.7%. Similarly, the statistical analysis conducted on geographies consisting of 412,149,174 people shows a mild positive correlation between the proportion of Austrians and percentage of births to unmarried women in the United States with a correlation coefficient (R) of 0.352 and weighted average of 31.0%, a difference of 8.1%.
Births to Unmarried Women Correlation Summary
| Measurement | Immigrants from Austria | Austrian |
| Minimum | 7.2% | 9.1% |
| Maximum | 100.0% | 100.0% |
| Range | 92.8% | 90.9% |
| Mean | 45.2% | 56.0% |
| Median | 36.4% | 44.8% |
| Interquartile 25% (IQ1) | 24.4% | 32.1% |
| Interquartile 75% (IQ3) | 71.3% | 84.4% |
| Interquartile Range (IQR) | 46.9% | 52.4% |
| Standard Deviation (Sample) | 28.3% | 29.5% |
| Standard Deviation (Population) | 27.9% | 28.9% |
Similar Demographics by Births to Unmarried Women
Demographics Similar to Immigrants from Austria by Births to Unmarried Women
In terms of births to unmarried women, the demographic groups most similar to Immigrants from Austria are Immigrants from Afghanistan (28.7%, a difference of 0.040%), Danish (28.7%, a difference of 0.070%), Zimbabwean (28.7%, a difference of 0.090%), Romanian (28.7%, a difference of 0.11%), and Immigrants from Kuwait (28.8%, a difference of 0.18%).
| Demographics | Rating | Rank | Births to Unmarried Women |
| Immigrants | Bolivia | 98.5 /100 | #74 | Exceptional 28.6% |
| Immigrants | Switzerland | 98.4 /100 | #75 | Exceptional 28.6% |
| Israelis | 98.4 /100 | #76 | Exceptional 28.6% |
| Immigrants | Northern Europe | 98.3 /100 | #77 | Exceptional 28.6% |
| Zimbabweans | 98.2 /100 | #78 | Exceptional 28.7% |
| Danes | 98.2 /100 | #79 | Exceptional 28.7% |
| Immigrants | Afghanistan | 98.1 /100 | #80 | Exceptional 28.7% |
| Immigrants | Austria | 98.1 /100 | #81 | Exceptional 28.7% |
| Romanians | 98.0 /100 | #82 | Exceptional 28.7% |
| Immigrants | Kuwait | 98.0 /100 | #83 | Exceptional 28.8% |
| Immigrants | Poland | 97.6 /100 | #84 | Exceptional 28.9% |
| Sri Lankans | 97.5 /100 | #85 | Exceptional 28.9% |
| Immigrants | Jordan | 97.4 /100 | #86 | Exceptional 29.0% |
| Taiwanese | 97.3 /100 | #87 | Exceptional 29.0% |
| Immigrants | France | 97.3 /100 | #88 | Exceptional 29.0% |
Demographics Similar to Austrians by Births to Unmarried Women
In terms of births to unmarried women, the demographic groups most similar to Austrians are Immigrants from England (31.1%, a difference of 0.060%), Immigrants from Western Europe (31.1%, a difference of 0.060%), Immigrants from Southern Europe (31.1%, a difference of 0.13%), Immigrants from Eastern Africa (31.0%, a difference of 0.27%), and Carpatho Rusyn (30.9%, a difference of 0.44%).
| Demographics | Rating | Rank | Births to Unmarried Women |
| Italians | 77.0 /100 | #151 | Good 30.8% |
| Poles | 76.2 /100 | #152 | Good 30.8% |
| British | 76.0 /100 | #153 | Good 30.8% |
| Yugoslavians | 75.1 /100 | #154 | Good 30.8% |
| Immigrants | Bangladesh | 73.9 /100 | #155 | Good 30.9% |
| Carpatho Rusyns | 73.5 /100 | #156 | Good 30.9% |
| Immigrants | Eastern Africa | 72.1 /100 | #157 | Good 31.0% |
| Austrians | 69.9 /100 | #158 | Good 31.0% |
| Immigrants | England | 69.4 /100 | #159 | Good 31.1% |
| Immigrants | Western Europe | 69.3 /100 | #160 | Good 31.1% |
| Immigrants | Southern Europe | 68.7 /100 | #161 | Good 31.1% |
| Slovenes | 65.9 /100 | #162 | Good 31.2% |
| Immigrants | Chile | 65.7 /100 | #163 | Good 31.2% |
| Hungarians | 64.1 /100 | #164 | Good 31.2% |
| Immigrants | Somalia | 58.1 /100 | #165 | Average 31.4% |