Immigrants from Austria vs Immigrants from Singapore Births to Unmarried Women
COMPARE
Immigrants from Austria
Immigrants from Singapore
Births to Unmarried Women
Births to Unmarried Women Comparison
Immigrants from Austria
Immigrants from Singapore
28.7%
BIRTHS TO UNMARRIED WOMEN
98.1/ 100
METRIC RATING
81st/ 347
METRIC RANK
25.6%
BIRTHS TO UNMARRIED WOMEN
100.0/ 100
METRIC RATING
15th/ 347
METRIC RANK
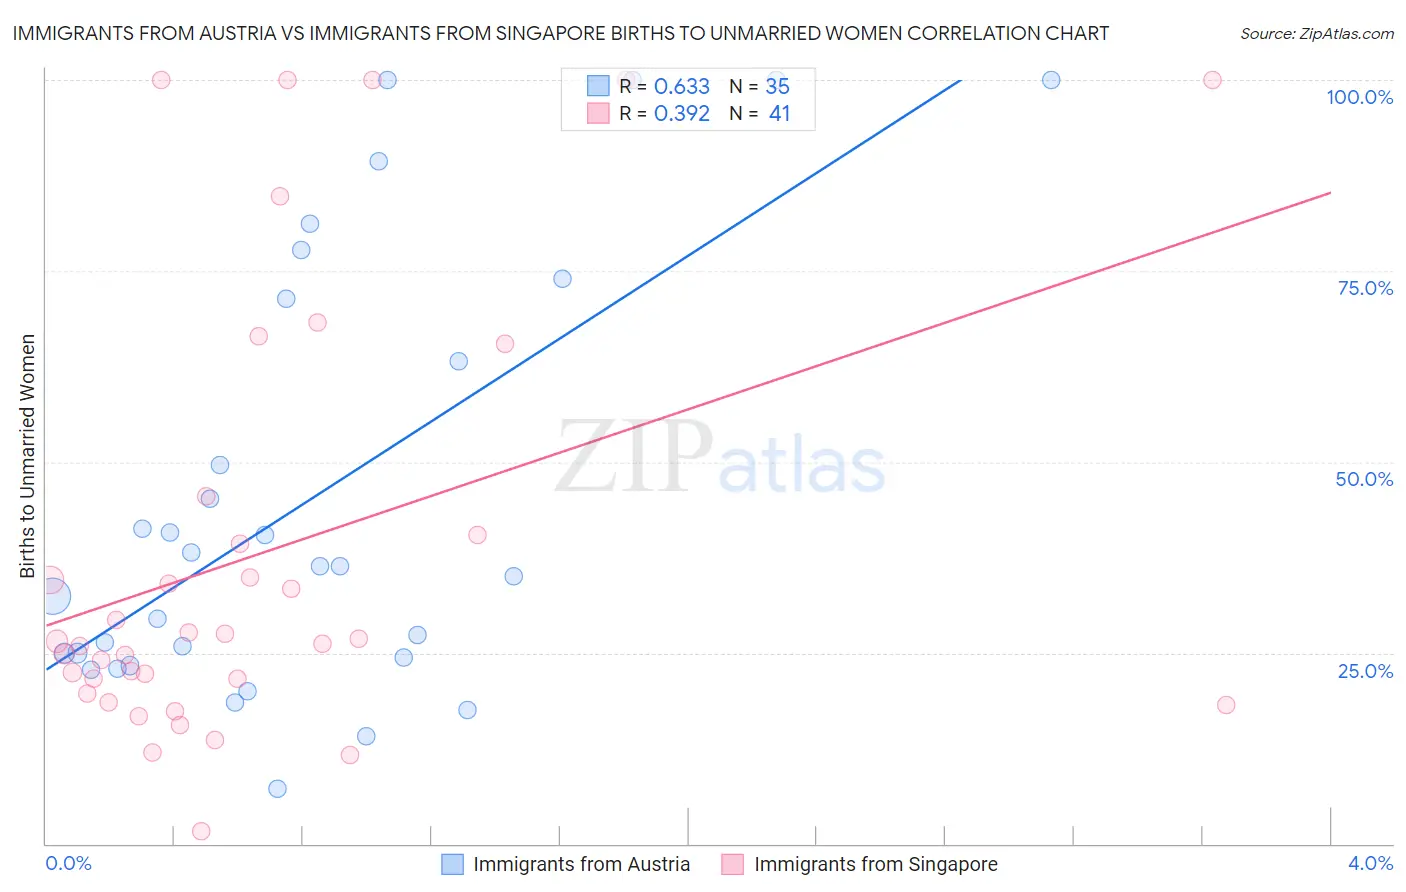
Immigrants from Austria vs Immigrants from Singapore Births to Unmarried Women Correlation Chart
The statistical analysis conducted on geographies consisting of 159,179,999 people shows a significant positive correlation between the proportion of Immigrants from Austria and percentage of births to unmarried women in the United States with a correlation coefficient (R) of 0.633 and weighted average of 28.7%. Similarly, the statistical analysis conducted on geographies consisting of 131,320,191 people shows a mild positive correlation between the proportion of Immigrants from Singapore and percentage of births to unmarried women in the United States with a correlation coefficient (R) of 0.392 and weighted average of 25.6%, a difference of 12.0%.
Births to Unmarried Women Correlation Summary
| Measurement | Immigrants from Austria | Immigrants from Singapore |
| Minimum | 7.2% | 1.7% |
| Maximum | 100.0% | 100.0% |
| Range | 92.8% | 98.3% |
| Mean | 45.2% | 38.2% |
| Median | 36.4% | 26.5% |
| Interquartile 25% (IQ1) | 24.4% | 20.6% |
| Interquartile 75% (IQ3) | 71.3% | 43.0% |
| Interquartile Range (IQR) | 46.9% | 22.4% |
| Standard Deviation (Sample) | 28.3% | 28.5% |
| Standard Deviation (Population) | 27.9% | 28.1% |
Similar Demographics by Births to Unmarried Women
Demographics Similar to Immigrants from Austria by Births to Unmarried Women
In terms of births to unmarried women, the demographic groups most similar to Immigrants from Austria are Immigrants from Afghanistan (28.7%, a difference of 0.040%), Danish (28.7%, a difference of 0.070%), Zimbabwean (28.7%, a difference of 0.090%), Romanian (28.7%, a difference of 0.11%), and Immigrants from Kuwait (28.8%, a difference of 0.18%).
| Demographics | Rating | Rank | Births to Unmarried Women |
| Immigrants | Bolivia | 98.5 /100 | #74 | Exceptional 28.6% |
| Immigrants | Switzerland | 98.4 /100 | #75 | Exceptional 28.6% |
| Israelis | 98.4 /100 | #76 | Exceptional 28.6% |
| Immigrants | Northern Europe | 98.3 /100 | #77 | Exceptional 28.6% |
| Zimbabweans | 98.2 /100 | #78 | Exceptional 28.7% |
| Danes | 98.2 /100 | #79 | Exceptional 28.7% |
| Immigrants | Afghanistan | 98.1 /100 | #80 | Exceptional 28.7% |
| Immigrants | Austria | 98.1 /100 | #81 | Exceptional 28.7% |
| Romanians | 98.0 /100 | #82 | Exceptional 28.7% |
| Immigrants | Kuwait | 98.0 /100 | #83 | Exceptional 28.8% |
| Immigrants | Poland | 97.6 /100 | #84 | Exceptional 28.9% |
| Sri Lankans | 97.5 /100 | #85 | Exceptional 28.9% |
| Immigrants | Jordan | 97.4 /100 | #86 | Exceptional 29.0% |
| Taiwanese | 97.3 /100 | #87 | Exceptional 29.0% |
| Immigrants | France | 97.3 /100 | #88 | Exceptional 29.0% |
Demographics Similar to Immigrants from Singapore by Births to Unmarried Women
In terms of births to unmarried women, the demographic groups most similar to Immigrants from Singapore are Immigrants from Belarus (25.6%, a difference of 0.050%), Immigrants from Uzbekistan (25.8%, a difference of 0.62%), Immigrants from Lebanon (25.3%, a difference of 1.2%), Iranian (25.3%, a difference of 1.3%), and Indian (Asian) (25.3%, a difference of 1.4%).
| Demographics | Rating | Rank | Births to Unmarried Women |
| Immigrants | China | 100.0 /100 | #8 | Exceptional 24.7% |
| Immigrants | South Central Asia | 100.0 /100 | #9 | Exceptional 24.7% |
| Immigrants | Eastern Asia | 100.0 /100 | #10 | Exceptional 25.0% |
| Immigrants | Israel | 100.0 /100 | #11 | Exceptional 25.1% |
| Indians (Asian) | 100.0 /100 | #12 | Exceptional 25.3% |
| Iranians | 100.0 /100 | #13 | Exceptional 25.3% |
| Immigrants | Lebanon | 100.0 /100 | #14 | Exceptional 25.3% |
| Immigrants | Singapore | 100.0 /100 | #15 | Exceptional 25.6% |
| Immigrants | Belarus | 100.0 /100 | #16 | Exceptional 25.6% |
| Immigrants | Uzbekistan | 100.0 /100 | #17 | Exceptional 25.8% |
| Immigrants | Armenia | 99.9 /100 | #18 | Exceptional 26.1% |
| Armenians | 99.9 /100 | #19 | Exceptional 26.2% |
| Immigrants | Korea | 99.9 /100 | #20 | Exceptional 26.3% |
| Soviet Union | 99.9 /100 | #21 | Exceptional 26.3% |
| Burmese | 99.9 /100 | #22 | Exceptional 26.4% |