Immigrants from Austria vs Immigrants from Cameroon Births to Unmarried Women
COMPARE
Immigrants from Austria
Immigrants from Cameroon
Births to Unmarried Women
Births to Unmarried Women Comparison
Immigrants from Austria
Immigrants from Cameroon
28.7%
BIRTHS TO UNMARRIED WOMEN
98.1/ 100
METRIC RATING
81st/ 347
METRIC RANK
34.7%
BIRTHS TO UNMARRIED WOMEN
1.6/ 100
METRIC RATING
236th/ 347
METRIC RANK
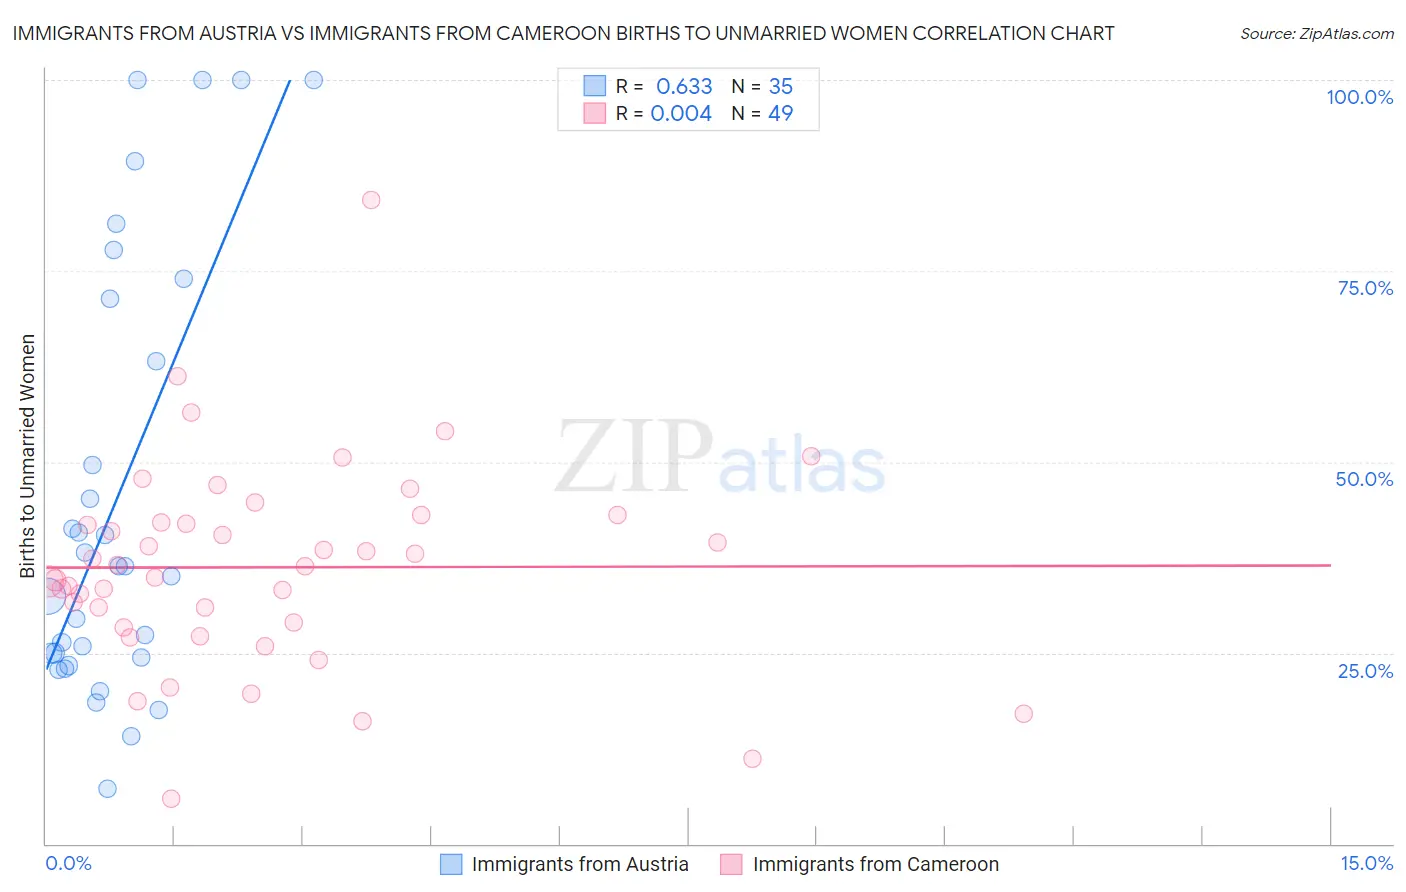
Immigrants from Austria vs Immigrants from Cameroon Births to Unmarried Women Correlation Chart
The statistical analysis conducted on geographies consisting of 159,179,999 people shows a significant positive correlation between the proportion of Immigrants from Austria and percentage of births to unmarried women in the United States with a correlation coefficient (R) of 0.633 and weighted average of 28.7%. Similarly, the statistical analysis conducted on geographies consisting of 128,569,403 people shows no correlation between the proportion of Immigrants from Cameroon and percentage of births to unmarried women in the United States with a correlation coefficient (R) of 0.004 and weighted average of 34.7%, a difference of 20.9%.
Births to Unmarried Women Correlation Summary
| Measurement | Immigrants from Austria | Immigrants from Cameroon |
| Minimum | 7.2% | 5.9% |
| Maximum | 100.0% | 84.3% |
| Range | 92.8% | 78.4% |
| Mean | 45.2% | 36.2% |
| Median | 36.4% | 36.4% |
| Interquartile 25% (IQ1) | 24.4% | 28.6% |
| Interquartile 75% (IQ3) | 71.3% | 42.5% |
| Interquartile Range (IQR) | 46.9% | 13.9% |
| Standard Deviation (Sample) | 28.3% | 13.4% |
| Standard Deviation (Population) | 27.9% | 13.2% |
Similar Demographics by Births to Unmarried Women
Demographics Similar to Immigrants from Austria by Births to Unmarried Women
In terms of births to unmarried women, the demographic groups most similar to Immigrants from Austria are Immigrants from Afghanistan (28.7%, a difference of 0.040%), Danish (28.7%, a difference of 0.070%), Zimbabwean (28.7%, a difference of 0.090%), Romanian (28.7%, a difference of 0.11%), and Immigrants from Kuwait (28.8%, a difference of 0.18%).
| Demographics | Rating | Rank | Births to Unmarried Women |
| Immigrants | Bolivia | 98.5 /100 | #74 | Exceptional 28.6% |
| Immigrants | Switzerland | 98.4 /100 | #75 | Exceptional 28.6% |
| Israelis | 98.4 /100 | #76 | Exceptional 28.6% |
| Immigrants | Northern Europe | 98.3 /100 | #77 | Exceptional 28.6% |
| Zimbabweans | 98.2 /100 | #78 | Exceptional 28.7% |
| Danes | 98.2 /100 | #79 | Exceptional 28.7% |
| Immigrants | Afghanistan | 98.1 /100 | #80 | Exceptional 28.7% |
| Immigrants | Austria | 98.1 /100 | #81 | Exceptional 28.7% |
| Romanians | 98.0 /100 | #82 | Exceptional 28.7% |
| Immigrants | Kuwait | 98.0 /100 | #83 | Exceptional 28.8% |
| Immigrants | Poland | 97.6 /100 | #84 | Exceptional 28.9% |
| Sri Lankans | 97.5 /100 | #85 | Exceptional 28.9% |
| Immigrants | Jordan | 97.4 /100 | #86 | Exceptional 29.0% |
| Taiwanese | 97.3 /100 | #87 | Exceptional 29.0% |
| Immigrants | France | 97.3 /100 | #88 | Exceptional 29.0% |
Demographics Similar to Immigrants from Cameroon by Births to Unmarried Women
In terms of births to unmarried women, the demographic groups most similar to Immigrants from Cameroon are Marshallese (34.8%, a difference of 0.070%), Immigrants from Cambodia (34.8%, a difference of 0.13%), Sierra Leonean (34.9%, a difference of 0.36%), Immigrants from Middle Africa (34.9%, a difference of 0.61%), and Immigrants from Ghana (34.5%, a difference of 0.63%).
| Demographics | Rating | Rank | Births to Unmarried Women |
| Immigrants | Sierra Leone | 3.1 /100 | #229 | Tragic 34.2% |
| Ghanaians | 3.1 /100 | #230 | Tragic 34.3% |
| Native Hawaiians | 2.9 /100 | #231 | Tragic 34.3% |
| French Canadians | 2.5 /100 | #232 | Tragic 34.4% |
| Bangladeshis | 2.5 /100 | #233 | Tragic 34.4% |
| Immigrants | Zaire | 2.3 /100 | #234 | Tragic 34.5% |
| Immigrants | Ghana | 2.2 /100 | #235 | Tragic 34.5% |
| Immigrants | Cameroon | 1.6 /100 | #236 | Tragic 34.7% |
| Marshallese | 1.6 /100 | #237 | Tragic 34.8% |
| Immigrants | Cambodia | 1.6 /100 | #238 | Tragic 34.8% |
| Sierra Leoneans | 1.4 /100 | #239 | Tragic 34.9% |
| Immigrants | Middle Africa | 1.2 /100 | #240 | Tragic 34.9% |
| Immigrants | Guyana | 1.2 /100 | #241 | Tragic 35.0% |
| Indonesians | 1.2 /100 | #242 | Tragic 35.0% |
| Japanese | 0.9 /100 | #243 | Tragic 35.2% |