Immigrants from Austria vs Ghanaian Births to Unmarried Women
COMPARE
Immigrants from Austria
Ghanaian
Births to Unmarried Women
Births to Unmarried Women Comparison
Immigrants from Austria
Ghanaians
28.7%
BIRTHS TO UNMARRIED WOMEN
98.1/ 100
METRIC RATING
81st/ 347
METRIC RANK
34.3%
BIRTHS TO UNMARRIED WOMEN
3.1/ 100
METRIC RATING
230th/ 347
METRIC RANK
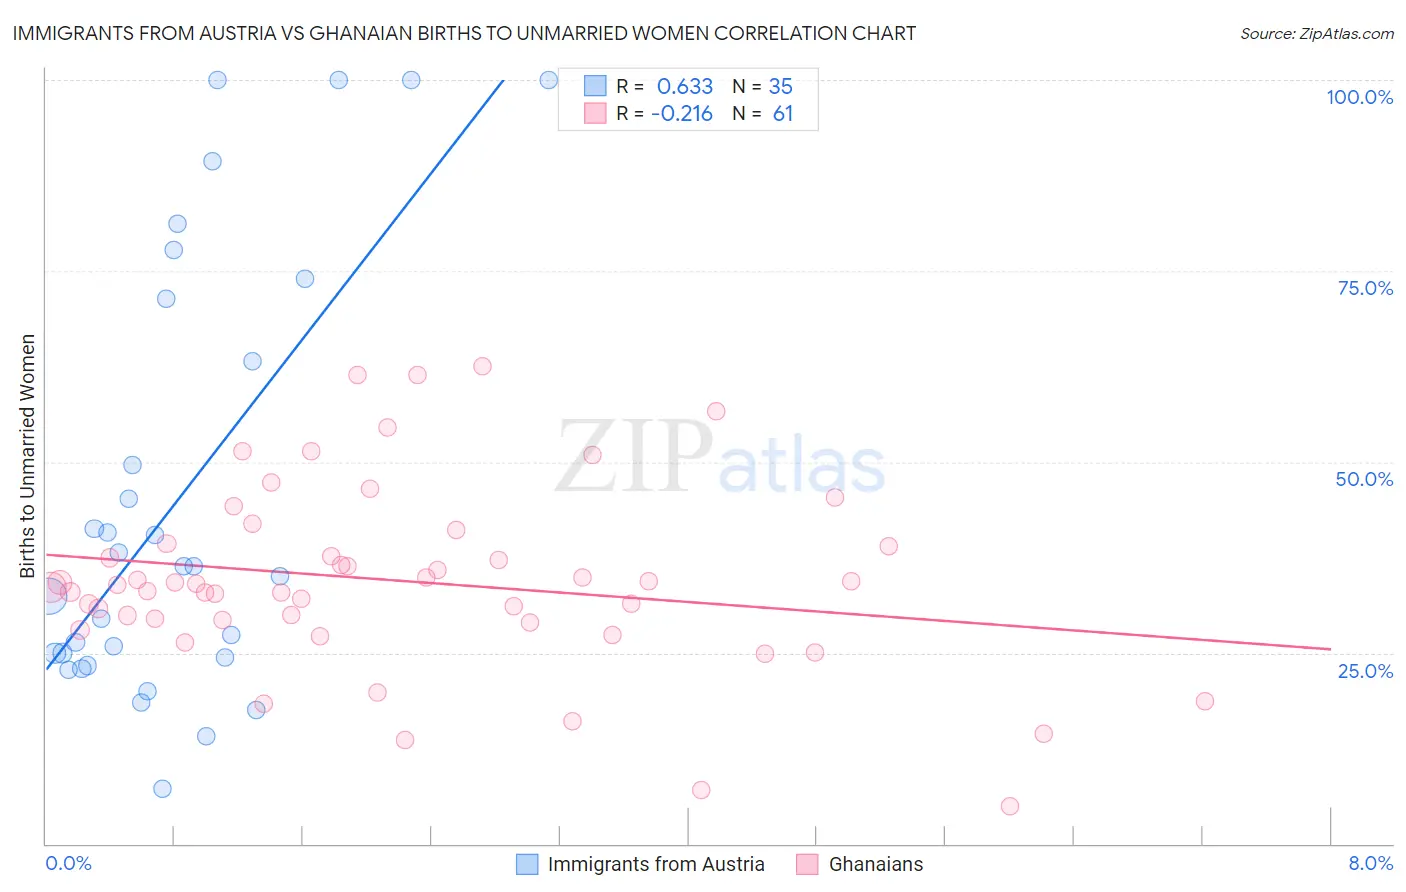
Immigrants from Austria vs Ghanaian Births to Unmarried Women Correlation Chart
The statistical analysis conducted on geographies consisting of 159,179,999 people shows a significant positive correlation between the proportion of Immigrants from Austria and percentage of births to unmarried women in the United States with a correlation coefficient (R) of 0.633 and weighted average of 28.7%. Similarly, the statistical analysis conducted on geographies consisting of 184,401,191 people shows a weak negative correlation between the proportion of Ghanaians and percentage of births to unmarried women in the United States with a correlation coefficient (R) of -0.216 and weighted average of 34.3%, a difference of 19.3%.
Births to Unmarried Women Correlation Summary
| Measurement | Immigrants from Austria | Ghanaian |
| Minimum | 7.2% | 4.9% |
| Maximum | 100.0% | 62.6% |
| Range | 92.8% | 57.7% |
| Mean | 45.2% | 34.4% |
| Median | 36.4% | 33.9% |
| Interquartile 25% (IQ1) | 24.4% | 29.2% |
| Interquartile 75% (IQ3) | 71.3% | 39.1% |
| Interquartile Range (IQR) | 46.9% | 9.9% |
| Standard Deviation (Sample) | 28.3% | 12.1% |
| Standard Deviation (Population) | 27.9% | 12.0% |
Similar Demographics by Births to Unmarried Women
Demographics Similar to Immigrants from Austria by Births to Unmarried Women
In terms of births to unmarried women, the demographic groups most similar to Immigrants from Austria are Immigrants from Afghanistan (28.7%, a difference of 0.040%), Danish (28.7%, a difference of 0.070%), Zimbabwean (28.7%, a difference of 0.090%), Romanian (28.7%, a difference of 0.11%), and Immigrants from Kuwait (28.8%, a difference of 0.18%).
| Demographics | Rating | Rank | Births to Unmarried Women |
| Immigrants | Bolivia | 98.5 /100 | #74 | Exceptional 28.6% |
| Immigrants | Switzerland | 98.4 /100 | #75 | Exceptional 28.6% |
| Israelis | 98.4 /100 | #76 | Exceptional 28.6% |
| Immigrants | Northern Europe | 98.3 /100 | #77 | Exceptional 28.6% |
| Zimbabweans | 98.2 /100 | #78 | Exceptional 28.7% |
| Danes | 98.2 /100 | #79 | Exceptional 28.7% |
| Immigrants | Afghanistan | 98.1 /100 | #80 | Exceptional 28.7% |
| Immigrants | Austria | 98.1 /100 | #81 | Exceptional 28.7% |
| Romanians | 98.0 /100 | #82 | Exceptional 28.7% |
| Immigrants | Kuwait | 98.0 /100 | #83 | Exceptional 28.8% |
| Immigrants | Poland | 97.6 /100 | #84 | Exceptional 28.9% |
| Sri Lankans | 97.5 /100 | #85 | Exceptional 28.9% |
| Immigrants | Jordan | 97.4 /100 | #86 | Exceptional 29.0% |
| Taiwanese | 97.3 /100 | #87 | Exceptional 29.0% |
| Immigrants | France | 97.3 /100 | #88 | Exceptional 29.0% |
Demographics Similar to Ghanaians by Births to Unmarried Women
In terms of births to unmarried women, the demographic groups most similar to Ghanaians are Immigrants from Sierra Leone (34.2%, a difference of 0.020%), Panamanian (34.2%, a difference of 0.13%), Native Hawaiian (34.3%, a difference of 0.14%), Immigrants from Panama (34.2%, a difference of 0.17%), and Delaware (34.2%, a difference of 0.18%).
| Demographics | Rating | Rank | Births to Unmarried Women |
| Pennsylvania Germans | 4.3 /100 | #223 | Tragic 34.0% |
| Immigrants | Laos | 4.3 /100 | #224 | Tragic 34.0% |
| Spanish | 4.0 /100 | #225 | Tragic 34.1% |
| Delaware | 3.3 /100 | #226 | Tragic 34.2% |
| Immigrants | Panama | 3.3 /100 | #227 | Tragic 34.2% |
| Panamanians | 3.3 /100 | #228 | Tragic 34.2% |
| Immigrants | Sierra Leone | 3.1 /100 | #229 | Tragic 34.2% |
| Ghanaians | 3.1 /100 | #230 | Tragic 34.3% |
| Native Hawaiians | 2.9 /100 | #231 | Tragic 34.3% |
| French Canadians | 2.5 /100 | #232 | Tragic 34.4% |
| Bangladeshis | 2.5 /100 | #233 | Tragic 34.4% |
| Immigrants | Zaire | 2.3 /100 | #234 | Tragic 34.5% |
| Immigrants | Ghana | 2.2 /100 | #235 | Tragic 34.5% |
| Immigrants | Cameroon | 1.6 /100 | #236 | Tragic 34.7% |
| Marshallese | 1.6 /100 | #237 | Tragic 34.8% |