Chickasaw vs Sudanese Average Family Size
COMPARE
Chickasaw
Sudanese
Average Family Size
Average Family Size Comparison
Chickasaw
Sudanese
3.19
AVERAGE FAMILY SIZE
6.0/ 100
METRIC RATING
226th/ 347
METRIC RANK
3.20
AVERAGE FAMILY SIZE
13.3/ 100
METRIC RATING
209th/ 347
METRIC RANK
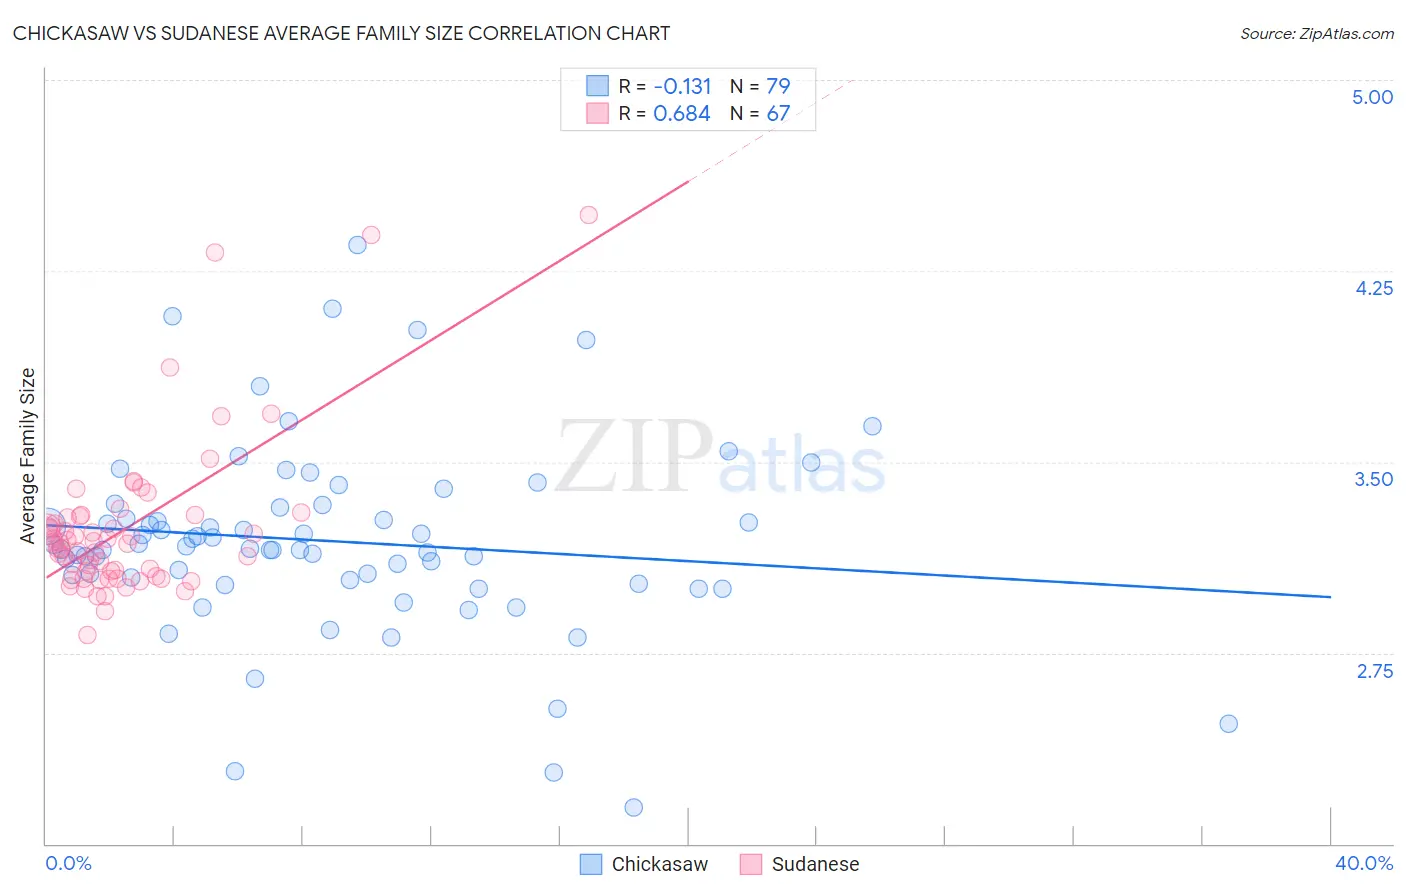
Chickasaw vs Sudanese Average Family Size Correlation Chart
The statistical analysis conducted on geographies consisting of 147,674,515 people shows a poor negative correlation between the proportion of Chickasaw and average family size in the United States with a correlation coefficient (R) of -0.131 and weighted average of 3.19. Similarly, the statistical analysis conducted on geographies consisting of 110,078,191 people shows a significant positive correlation between the proportion of Sudanese and average family size in the United States with a correlation coefficient (R) of 0.684 and weighted average of 3.20, a difference of 0.40%.
Average Family Size Correlation Summary
| Measurement | Chickasaw | Sudanese |
| Minimum | 2.14 | 2.82 |
| Maximum | 4.35 | 4.47 |
| Range | 2.21 | 1.65 |
| Mean | 3.19 | 3.24 |
| Median | 3.16 | 3.18 |
| Interquartile 25% (IQ1) | 3.04 | 3.05 |
| Interquartile 75% (IQ3) | 3.32 | 3.28 |
| Interquartile Range (IQR) | 0.28 | 0.23 |
| Standard Deviation (Sample) | 0.38 | 0.31 |
| Standard Deviation (Population) | 0.37 | 0.31 |
Demographics Similar to Chickasaw and Sudanese by Average Family Size
In terms of average family size, the demographic groups most similar to Chickasaw are Portuguese (3.19, a difference of 0.0%), Cree (3.19, a difference of 0.020%), Syrian (3.19, a difference of 0.040%), Immigrants from Zimbabwe (3.19, a difference of 0.080%), and Immigrants from Ukraine (3.19, a difference of 0.090%). Similarly, the demographic groups most similar to Sudanese are Chippewa (3.20, a difference of 0.0%), Filipino (3.20, a difference of 0.010%), Zimbabwean (3.20, a difference of 0.030%), Immigrants from Iran (3.20, a difference of 0.050%), and Creek (3.20, a difference of 0.050%).
| Demographics | Rating | Rank | Average Family Size |
| Filipinos | 13.6 /100 | #207 | Poor 3.20 |
| Chippewa | 13.3 /100 | #208 | Poor 3.20 |
| Sudanese | 13.3 /100 | #209 | Poor 3.20 |
| Zimbabweans | 12.6 /100 | #210 | Poor 3.20 |
| Immigrants | Iran | 12.1 /100 | #211 | Poor 3.20 |
| Creek | 12.1 /100 | #212 | Poor 3.20 |
| Mongolians | 11.5 /100 | #213 | Poor 3.20 |
| Somalis | 11.2 /100 | #214 | Poor 3.20 |
| Delaware | 11.1 /100 | #215 | Poor 3.20 |
| Bermudans | 11.0 /100 | #216 | Poor 3.20 |
| Immigrants | Somalia | 10.3 /100 | #217 | Poor 3.20 |
| French American Indians | 9.8 /100 | #218 | Tragic 3.20 |
| Pennsylvania Germans | 9.3 /100 | #219 | Tragic 3.19 |
| Lebanese | 9.1 /100 | #220 | Tragic 3.19 |
| Immigrants | Ukraine | 7.2 /100 | #221 | Tragic 3.19 |
| Immigrants | Kuwait | 7.2 /100 | #222 | Tragic 3.19 |
| Immigrants | Zimbabwe | 7.1 /100 | #223 | Tragic 3.19 |
| Syrians | 6.5 /100 | #224 | Tragic 3.19 |
| Cree | 6.2 /100 | #225 | Tragic 3.19 |
| Chickasaw | 6.0 /100 | #226 | Tragic 3.19 |
| Portuguese | 6.0 /100 | #227 | Tragic 3.19 |