Chickasaw vs Immigrants from Uruguay Average Family Size
COMPARE
Chickasaw
Immigrants from Uruguay
Average Family Size
Average Family Size Comparison
Chickasaw
Immigrants from Uruguay
3.19
AVERAGE FAMILY SIZE
6.0/ 100
METRIC RATING
226th/ 347
METRIC RANK
3.23
AVERAGE FAMILY SIZE
52.0/ 100
METRIC RATING
173rd/ 347
METRIC RANK
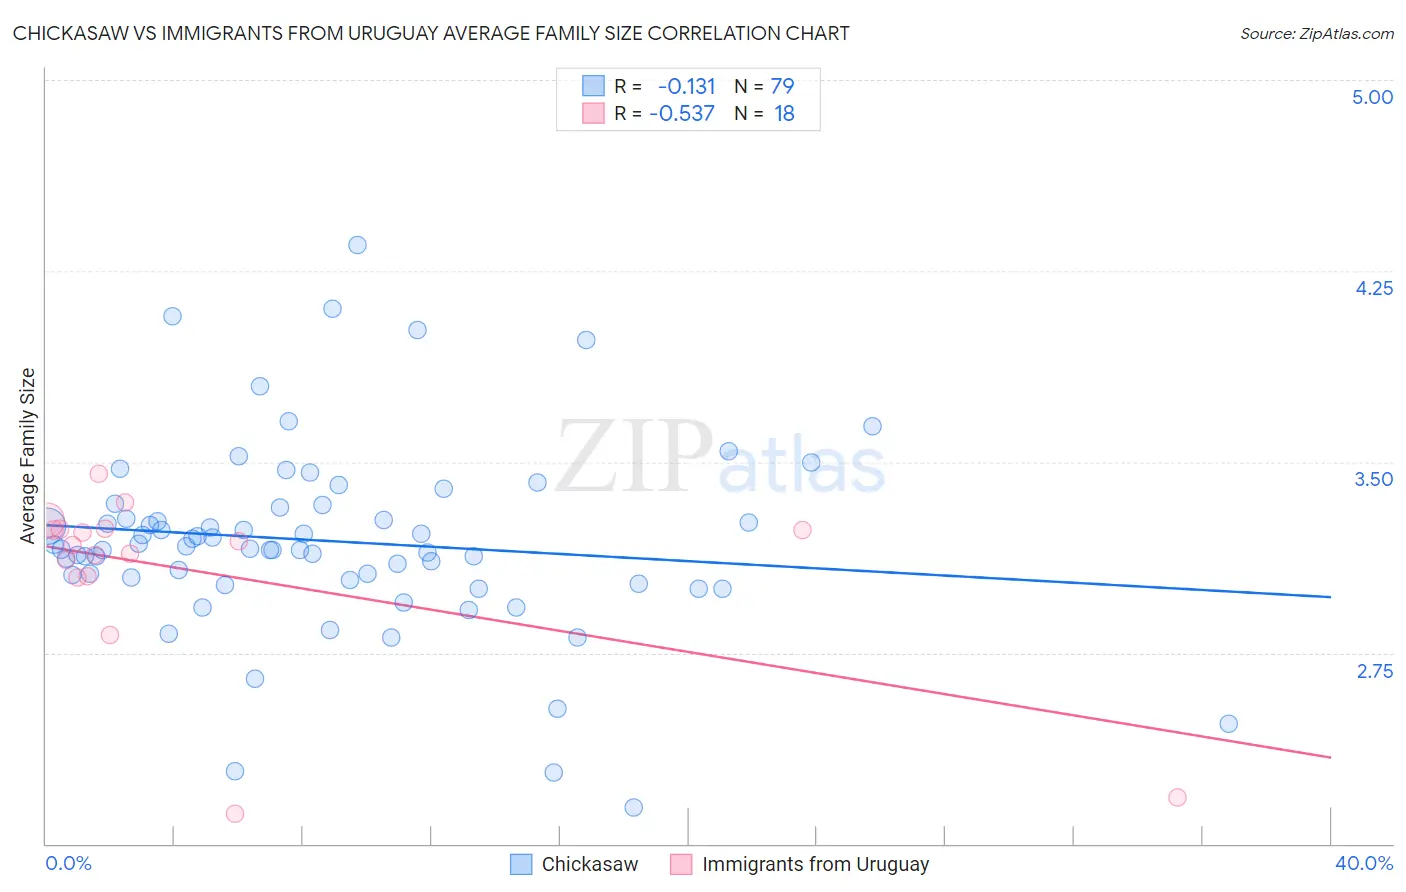
Chickasaw vs Immigrants from Uruguay Average Family Size Correlation Chart
The statistical analysis conducted on geographies consisting of 147,674,515 people shows a poor negative correlation between the proportion of Chickasaw and average family size in the United States with a correlation coefficient (R) of -0.131 and weighted average of 3.19. Similarly, the statistical analysis conducted on geographies consisting of 133,245,142 people shows a substantial negative correlation between the proportion of Immigrants from Uruguay and average family size in the United States with a correlation coefficient (R) of -0.537 and weighted average of 3.23, a difference of 1.3%.
Average Family Size Correlation Summary
| Measurement | Chickasaw | Immigrants from Uruguay |
| Minimum | 2.14 | 2.12 |
| Maximum | 4.35 | 3.46 |
| Range | 2.21 | 1.34 |
| Mean | 3.19 | 3.07 |
| Median | 3.16 | 3.18 |
| Interquartile 25% (IQ1) | 3.04 | 3.05 |
| Interquartile 75% (IQ3) | 3.32 | 3.24 |
| Interquartile Range (IQR) | 0.28 | 0.19 |
| Standard Deviation (Sample) | 0.38 | 0.36 |
| Standard Deviation (Population) | 0.37 | 0.35 |
Similar Demographics by Average Family Size
Demographics Similar to Chickasaw by Average Family Size
In terms of average family size, the demographic groups most similar to Chickasaw are Portuguese (3.19, a difference of 0.0%), Cree (3.19, a difference of 0.020%), Nonimmigrants (3.19, a difference of 0.030%), Syrian (3.19, a difference of 0.040%), and Immigrants from Italy (3.19, a difference of 0.060%).
| Demographics | Rating | Rank | Average Family Size |
| Pennsylvania Germans | 9.3 /100 | #219 | Tragic 3.19 |
| Lebanese | 9.1 /100 | #220 | Tragic 3.19 |
| Immigrants | Ukraine | 7.2 /100 | #221 | Tragic 3.19 |
| Immigrants | Kuwait | 7.2 /100 | #222 | Tragic 3.19 |
| Immigrants | Zimbabwe | 7.1 /100 | #223 | Tragic 3.19 |
| Syrians | 6.5 /100 | #224 | Tragic 3.19 |
| Cree | 6.2 /100 | #225 | Tragic 3.19 |
| Chickasaw | 6.0 /100 | #226 | Tragic 3.19 |
| Portuguese | 6.0 /100 | #227 | Tragic 3.19 |
| Immigrants | Nonimmigrants | 5.7 /100 | #228 | Tragic 3.19 |
| Immigrants | Italy | 5.3 /100 | #229 | Tragic 3.19 |
| Icelanders | 5.2 /100 | #230 | Tragic 3.19 |
| Basques | 5.2 /100 | #231 | Tragic 3.19 |
| Cherokee | 4.7 /100 | #232 | Tragic 3.18 |
| Brazilians | 4.5 /100 | #233 | Tragic 3.18 |
Demographics Similar to Immigrants from Uruguay by Average Family Size
In terms of average family size, the demographic groups most similar to Immigrants from Uruguay are Immigrants from Congo (3.23, a difference of 0.010%), Chilean (3.23, a difference of 0.020%), Arab (3.23, a difference of 0.030%), Taiwanese (3.23, a difference of 0.040%), and Aleut (3.23, a difference of 0.040%).
| Demographics | Rating | Rank | Average Family Size |
| Immigrants | Senegal | 57.5 /100 | #166 | Average 3.23 |
| Dutch West Indians | 56.9 /100 | #167 | Average 3.23 |
| Taiwanese | 54.2 /100 | #168 | Average 3.23 |
| Aleuts | 54.1 /100 | #169 | Average 3.23 |
| Arabs | 53.8 /100 | #170 | Average 3.23 |
| Chileans | 53.2 /100 | #171 | Average 3.23 |
| Immigrants | Congo | 52.7 /100 | #172 | Average 3.23 |
| Immigrants | Uruguay | 52.0 /100 | #173 | Average 3.23 |
| Immigrants | South Central Asia | 50.0 /100 | #174 | Average 3.23 |
| Immigrants | China | 49.9 /100 | #175 | Average 3.23 |
| Israelis | 48.7 /100 | #176 | Average 3.23 |
| Argentineans | 47.4 /100 | #177 | Average 3.23 |
| Spaniards | 47.2 /100 | #178 | Average 3.23 |
| Immigrants | Korea | 46.9 /100 | #179 | Average 3.23 |
| Palestinians | 46.6 /100 | #180 | Average 3.23 |