Chickasaw vs Immigrants from Singapore Average Family Size
COMPARE
Chickasaw
Immigrants from Singapore
Average Family Size
Average Family Size Comparison
Chickasaw
Immigrants from Singapore
3.19
AVERAGE FAMILY SIZE
6.0/ 100
METRIC RATING
226th/ 347
METRIC RANK
3.16
AVERAGE FAMILY SIZE
0.7/ 100
METRIC RATING
269th/ 347
METRIC RANK
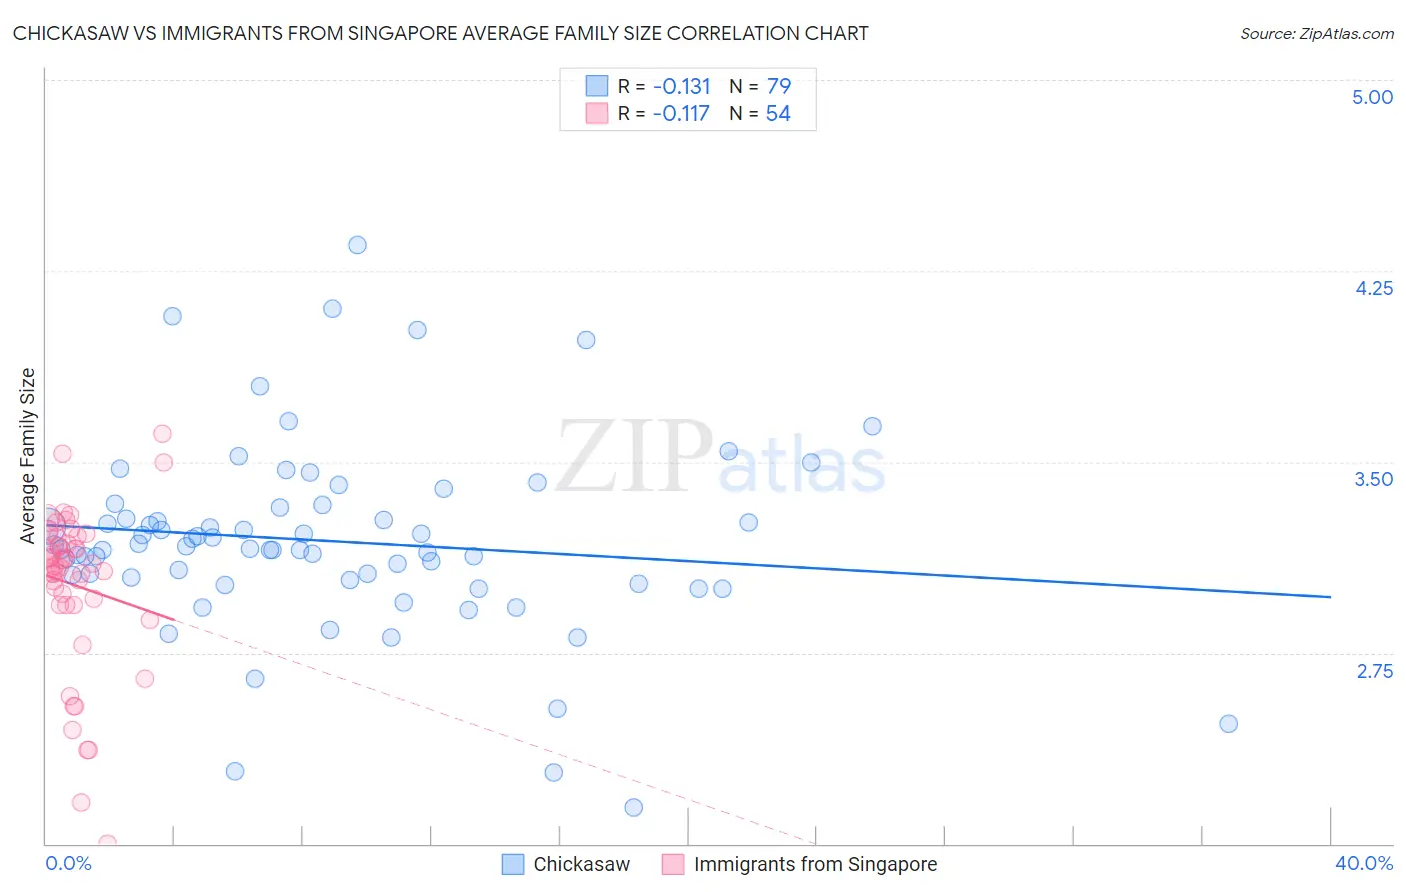
Chickasaw vs Immigrants from Singapore Average Family Size Correlation Chart
The statistical analysis conducted on geographies consisting of 147,674,515 people shows a poor negative correlation between the proportion of Chickasaw and average family size in the United States with a correlation coefficient (R) of -0.131 and weighted average of 3.19. Similarly, the statistical analysis conducted on geographies consisting of 137,456,280 people shows a poor negative correlation between the proportion of Immigrants from Singapore and average family size in the United States with a correlation coefficient (R) of -0.117 and weighted average of 3.16, a difference of 1.0%.
Average Family Size Correlation Summary
| Measurement | Chickasaw | Immigrants from Singapore |
| Minimum | 2.14 | 2.00 |
| Maximum | 4.35 | 3.61 |
| Range | 2.21 | 1.61 |
| Mean | 3.19 | 3.02 |
| Median | 3.16 | 3.09 |
| Interquartile 25% (IQ1) | 3.04 | 2.94 |
| Interquartile 75% (IQ3) | 3.32 | 3.20 |
| Interquartile Range (IQR) | 0.28 | 0.27 |
| Standard Deviation (Sample) | 0.38 | 0.32 |
| Standard Deviation (Population) | 0.37 | 0.32 |
Similar Demographics by Average Family Size
Demographics Similar to Chickasaw by Average Family Size
In terms of average family size, the demographic groups most similar to Chickasaw are Portuguese (3.19, a difference of 0.0%), Cree (3.19, a difference of 0.020%), Nonimmigrants (3.19, a difference of 0.030%), Syrian (3.19, a difference of 0.040%), and Immigrants from Italy (3.19, a difference of 0.060%).
| Demographics | Rating | Rank | Average Family Size |
| Pennsylvania Germans | 9.3 /100 | #219 | Tragic 3.19 |
| Lebanese | 9.1 /100 | #220 | Tragic 3.19 |
| Immigrants | Ukraine | 7.2 /100 | #221 | Tragic 3.19 |
| Immigrants | Kuwait | 7.2 /100 | #222 | Tragic 3.19 |
| Immigrants | Zimbabwe | 7.1 /100 | #223 | Tragic 3.19 |
| Syrians | 6.5 /100 | #224 | Tragic 3.19 |
| Cree | 6.2 /100 | #225 | Tragic 3.19 |
| Chickasaw | 6.0 /100 | #226 | Tragic 3.19 |
| Portuguese | 6.0 /100 | #227 | Tragic 3.19 |
| Immigrants | Nonimmigrants | 5.7 /100 | #228 | Tragic 3.19 |
| Immigrants | Italy | 5.3 /100 | #229 | Tragic 3.19 |
| Icelanders | 5.2 /100 | #230 | Tragic 3.19 |
| Basques | 5.2 /100 | #231 | Tragic 3.19 |
| Cherokee | 4.7 /100 | #232 | Tragic 3.18 |
| Brazilians | 4.5 /100 | #233 | Tragic 3.18 |
Demographics Similar to Immigrants from Singapore by Average Family Size
In terms of average family size, the demographic groups most similar to Immigrants from Singapore are Maltese (3.16, a difference of 0.010%), Tlingit-Haida (3.16, a difference of 0.030%), Iroquois (3.16, a difference of 0.050%), Immigrants from Germany (3.15, a difference of 0.050%), and Immigrants from Greece (3.16, a difference of 0.070%).
| Demographics | Rating | Rank | Average Family Size |
| Immigrants | Russia | 1.3 /100 | #262 | Tragic 3.16 |
| Immigrants | Bulgaria | 1.0 /100 | #263 | Tragic 3.16 |
| Americans | 1.0 /100 | #264 | Tragic 3.16 |
| Immigrants | South Africa | 0.9 /100 | #265 | Tragic 3.16 |
| Immigrants | Greece | 0.9 /100 | #266 | Tragic 3.16 |
| Iroquois | 0.8 /100 | #267 | Tragic 3.16 |
| Maltese | 0.8 /100 | #268 | Tragic 3.16 |
| Immigrants | Singapore | 0.7 /100 | #269 | Tragic 3.16 |
| Tlingit-Haida | 0.7 /100 | #270 | Tragic 3.16 |
| Immigrants | Germany | 0.7 /100 | #271 | Tragic 3.15 |
| Immigrants | Lithuania | 0.6 /100 | #272 | Tragic 3.15 |
| New Zealanders | 0.6 /100 | #273 | Tragic 3.15 |
| Immigrants | Belgium | 0.6 /100 | #274 | Tragic 3.15 |
| Cambodians | 0.6 /100 | #275 | Tragic 3.15 |
| Immigrants | Bosnia and Herzegovina | 0.5 /100 | #276 | Tragic 3.15 |