Brazilian vs Sudanese Average Family Size
COMPARE
Brazilian
Sudanese
Average Family Size
Average Family Size Comparison
Brazilians
Sudanese
3.18
AVERAGE FAMILY SIZE
4.5/ 100
METRIC RATING
233rd/ 347
METRIC RANK
3.20
AVERAGE FAMILY SIZE
13.3/ 100
METRIC RATING
209th/ 347
METRIC RANK
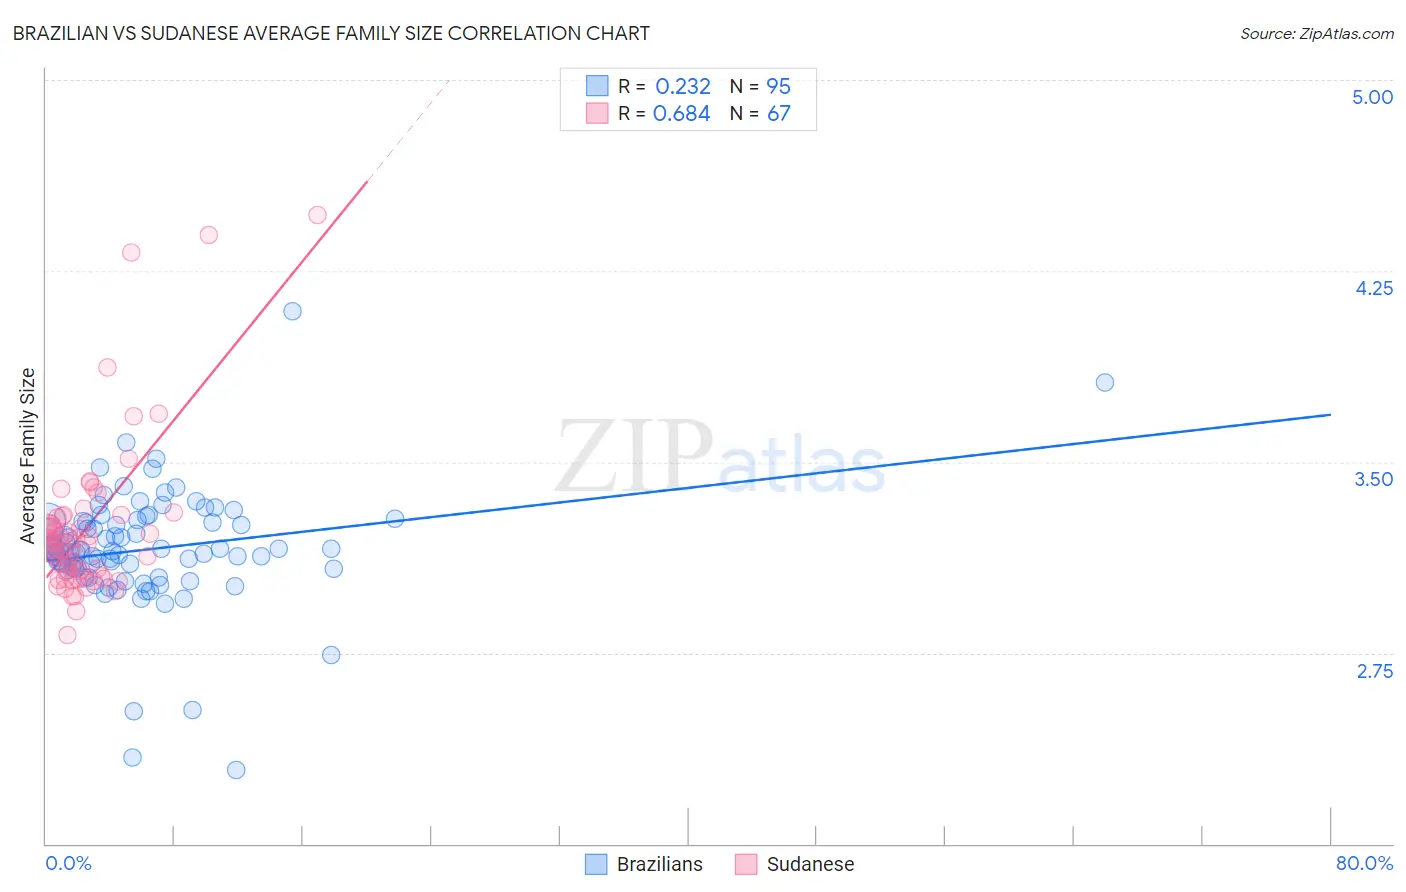
Brazilian vs Sudanese Average Family Size Correlation Chart
The statistical analysis conducted on geographies consisting of 323,732,012 people shows a weak positive correlation between the proportion of Brazilians and average family size in the United States with a correlation coefficient (R) of 0.232 and weighted average of 3.18. Similarly, the statistical analysis conducted on geographies consisting of 110,078,191 people shows a significant positive correlation between the proportion of Sudanese and average family size in the United States with a correlation coefficient (R) of 0.684 and weighted average of 3.20, a difference of 0.55%.
Average Family Size Correlation Summary
| Measurement | Brazilian | Sudanese |
| Minimum | 2.29 | 2.82 |
| Maximum | 4.09 | 4.47 |
| Range | 1.80 | 1.65 |
| Mean | 3.16 | 3.24 |
| Median | 3.15 | 3.18 |
| Interquartile 25% (IQ1) | 3.08 | 3.05 |
| Interquartile 75% (IQ3) | 3.26 | 3.28 |
| Interquartile Range (IQR) | 0.19 | 0.23 |
| Standard Deviation (Sample) | 0.24 | 0.31 |
| Standard Deviation (Population) | 0.24 | 0.31 |
Similar Demographics by Average Family Size
Demographics Similar to Brazilians by Average Family Size
In terms of average family size, the demographic groups most similar to Brazilians are Iranian (3.18, a difference of 0.0%), Cherokee (3.18, a difference of 0.020%), Immigrants from Turkey (3.18, a difference of 0.030%), Immigrants from Portugal (3.18, a difference of 0.040%), and Icelander (3.19, a difference of 0.070%).
| Demographics | Rating | Rank | Average Family Size |
| Chickasaw | 6.0 /100 | #226 | Tragic 3.19 |
| Portuguese | 6.0 /100 | #227 | Tragic 3.19 |
| Immigrants | Nonimmigrants | 5.7 /100 | #228 | Tragic 3.19 |
| Immigrants | Italy | 5.3 /100 | #229 | Tragic 3.19 |
| Icelanders | 5.2 /100 | #230 | Tragic 3.19 |
| Basques | 5.2 /100 | #231 | Tragic 3.19 |
| Cherokee | 4.7 /100 | #232 | Tragic 3.18 |
| Brazilians | 4.5 /100 | #233 | Tragic 3.18 |
| Iranians | 4.5 /100 | #234 | Tragic 3.18 |
| Immigrants | Turkey | 4.2 /100 | #235 | Tragic 3.18 |
| Immigrants | Portugal | 4.2 /100 | #236 | Tragic 3.18 |
| Immigrants | Romania | 3.7 /100 | #237 | Tragic 3.18 |
| Romanians | 3.7 /100 | #238 | Tragic 3.18 |
| Houma | 3.4 /100 | #239 | Tragic 3.18 |
| Osage | 3.2 /100 | #240 | Tragic 3.18 |
Demographics Similar to Sudanese by Average Family Size
In terms of average family size, the demographic groups most similar to Sudanese are Chippewa (3.20, a difference of 0.0%), Filipino (3.20, a difference of 0.010%), Zimbabwean (3.20, a difference of 0.030%), Immigrants from Iran (3.20, a difference of 0.050%), and Creek (3.20, a difference of 0.050%).
| Demographics | Rating | Rank | Average Family Size |
| Immigrants | India | 18.5 /100 | #202 | Poor 3.21 |
| Immigrants | Nepal | 18.1 /100 | #203 | Poor 3.21 |
| Immigrants | Poland | 16.6 /100 | #204 | Poor 3.20 |
| Paraguayans | 16.3 /100 | #205 | Poor 3.20 |
| Immigrants | Cabo Verde | 16.0 /100 | #206 | Poor 3.20 |
| Filipinos | 13.6 /100 | #207 | Poor 3.20 |
| Chippewa | 13.3 /100 | #208 | Poor 3.20 |
| Sudanese | 13.3 /100 | #209 | Poor 3.20 |
| Zimbabweans | 12.6 /100 | #210 | Poor 3.20 |
| Immigrants | Iran | 12.1 /100 | #211 | Poor 3.20 |
| Creek | 12.1 /100 | #212 | Poor 3.20 |
| Mongolians | 11.5 /100 | #213 | Poor 3.20 |
| Somalis | 11.2 /100 | #214 | Poor 3.20 |
| Delaware | 11.1 /100 | #215 | Poor 3.20 |
| Bermudans | 11.0 /100 | #216 | Poor 3.20 |