Chickasaw vs Costa Rican Average Family Size
COMPARE
Chickasaw
Costa Rican
Average Family Size
Average Family Size Comparison
Chickasaw
Costa Ricans
3.19
AVERAGE FAMILY SIZE
6.0/ 100
METRIC RATING
226th/ 347
METRIC RANK
3.26
AVERAGE FAMILY SIZE
86.8/ 100
METRIC RATING
132nd/ 347
METRIC RANK
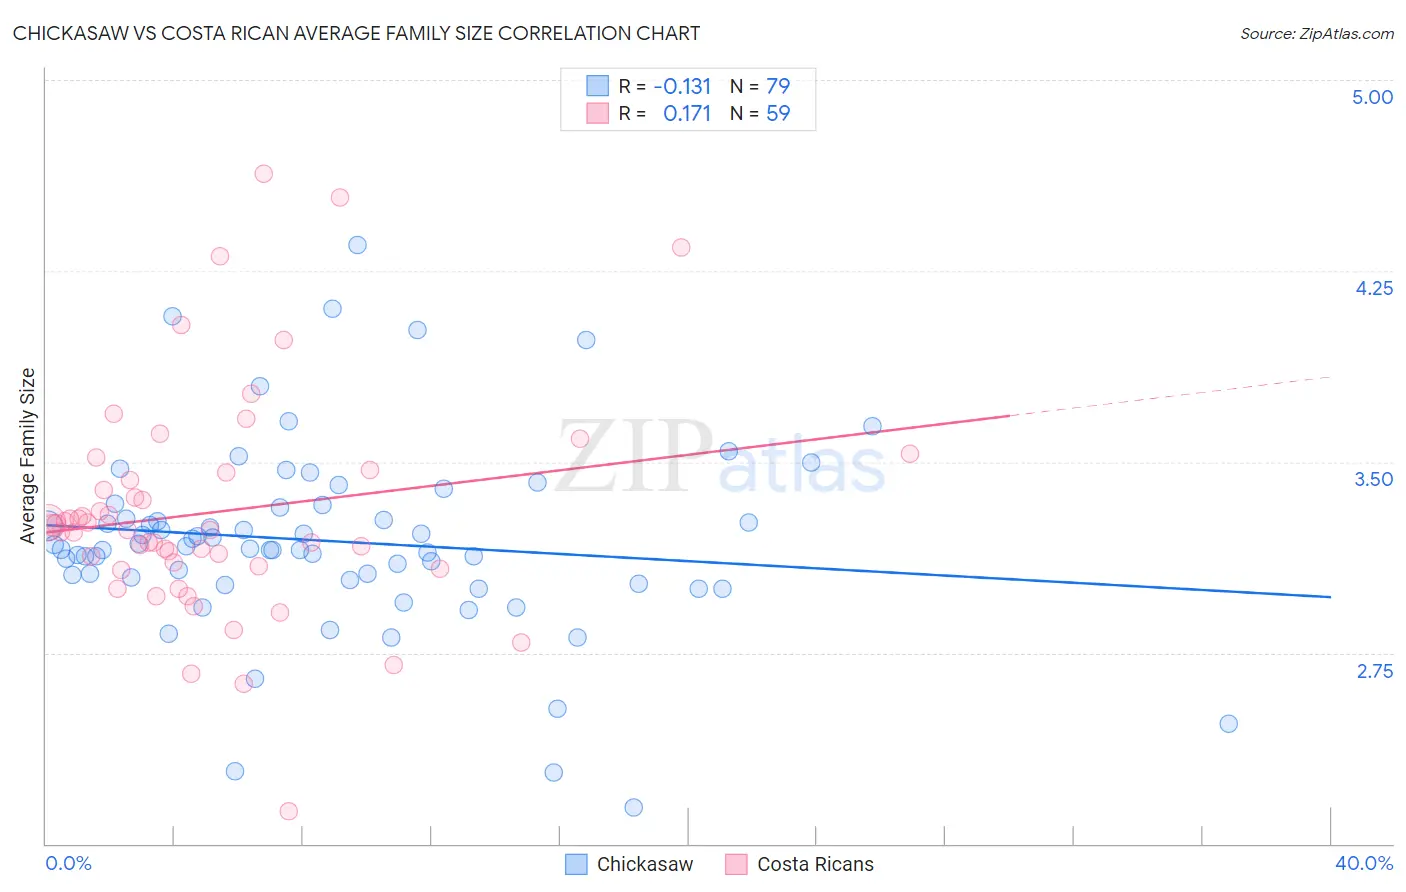
Chickasaw vs Costa Rican Average Family Size Correlation Chart
The statistical analysis conducted on geographies consisting of 147,674,515 people shows a poor negative correlation between the proportion of Chickasaw and average family size in the United States with a correlation coefficient (R) of -0.131 and weighted average of 3.19. Similarly, the statistical analysis conducted on geographies consisting of 253,470,463 people shows a poor positive correlation between the proportion of Costa Ricans and average family size in the United States with a correlation coefficient (R) of 0.171 and weighted average of 3.26, a difference of 2.1%.
Average Family Size Correlation Summary
| Measurement | Chickasaw | Costa Rican |
| Minimum | 2.14 | 2.13 |
| Maximum | 4.35 | 4.63 |
| Range | 2.21 | 2.50 |
| Mean | 3.19 | 3.30 |
| Median | 3.16 | 3.23 |
| Interquartile 25% (IQ1) | 3.04 | 3.09 |
| Interquartile 75% (IQ3) | 3.32 | 3.46 |
| Interquartile Range (IQR) | 0.28 | 0.37 |
| Standard Deviation (Sample) | 0.38 | 0.44 |
| Standard Deviation (Population) | 0.37 | 0.44 |
Similar Demographics by Average Family Size
Demographics Similar to Chickasaw by Average Family Size
In terms of average family size, the demographic groups most similar to Chickasaw are Portuguese (3.19, a difference of 0.0%), Cree (3.19, a difference of 0.020%), Nonimmigrants (3.19, a difference of 0.030%), Syrian (3.19, a difference of 0.040%), and Immigrants from Italy (3.19, a difference of 0.060%).
| Demographics | Rating | Rank | Average Family Size |
| Pennsylvania Germans | 9.3 /100 | #219 | Tragic 3.19 |
| Lebanese | 9.1 /100 | #220 | Tragic 3.19 |
| Immigrants | Ukraine | 7.2 /100 | #221 | Tragic 3.19 |
| Immigrants | Kuwait | 7.2 /100 | #222 | Tragic 3.19 |
| Immigrants | Zimbabwe | 7.1 /100 | #223 | Tragic 3.19 |
| Syrians | 6.5 /100 | #224 | Tragic 3.19 |
| Cree | 6.2 /100 | #225 | Tragic 3.19 |
| Chickasaw | 6.0 /100 | #226 | Tragic 3.19 |
| Portuguese | 6.0 /100 | #227 | Tragic 3.19 |
| Immigrants | Nonimmigrants | 5.7 /100 | #228 | Tragic 3.19 |
| Immigrants | Italy | 5.3 /100 | #229 | Tragic 3.19 |
| Icelanders | 5.2 /100 | #230 | Tragic 3.19 |
| Basques | 5.2 /100 | #231 | Tragic 3.19 |
| Cherokee | 4.7 /100 | #232 | Tragic 3.18 |
| Brazilians | 4.5 /100 | #233 | Tragic 3.18 |
Demographics Similar to Costa Ricans by Average Family Size
In terms of average family size, the demographic groups most similar to Costa Ricans are Immigrants from Venezuela (3.26, a difference of 0.020%), Immigrants from Western Asia (3.26, a difference of 0.040%), Laotian (3.26, a difference of 0.070%), African (3.25, a difference of 0.070%), and Immigrants from Hong Kong (3.26, a difference of 0.080%).
| Demographics | Rating | Rank | Average Family Size |
| Immigrants | Cuba | 91.3 /100 | #125 | Exceptional 3.26 |
| Immigrants | Costa Rica | 90.7 /100 | #126 | Exceptional 3.26 |
| Immigrants | Syria | 90.6 /100 | #127 | Exceptional 3.26 |
| Colombians | 89.9 /100 | #128 | Excellent 3.26 |
| Immigrants | Hong Kong | 88.6 /100 | #129 | Excellent 3.26 |
| Laotians | 88.5 /100 | #130 | Excellent 3.26 |
| Immigrants | Western Asia | 87.7 /100 | #131 | Excellent 3.26 |
| Costa Ricans | 86.8 /100 | #132 | Excellent 3.26 |
| Immigrants | Venezuela | 86.3 /100 | #133 | Excellent 3.26 |
| Africans | 84.9 /100 | #134 | Excellent 3.25 |
| Panamanians | 84.2 /100 | #135 | Excellent 3.25 |
| Comanche | 82.8 /100 | #136 | Excellent 3.25 |
| Immigrants | Middle Africa | 82.4 /100 | #137 | Excellent 3.25 |
| Cubans | 81.8 /100 | #138 | Excellent 3.25 |
| Immigrants | Ethiopia | 81.6 /100 | #139 | Excellent 3.25 |