Immigrants from the Azores vs Sudanese Average Family Size
COMPARE
Immigrants from the Azores
Sudanese
Average Family Size
Average Family Size Comparison
Immigrants from the Azores
Sudanese
3.21
AVERAGE FAMILY SIZE
21.7/ 100
METRIC RATING
198th/ 347
METRIC RANK
3.20
AVERAGE FAMILY SIZE
13.3/ 100
METRIC RATING
209th/ 347
METRIC RANK
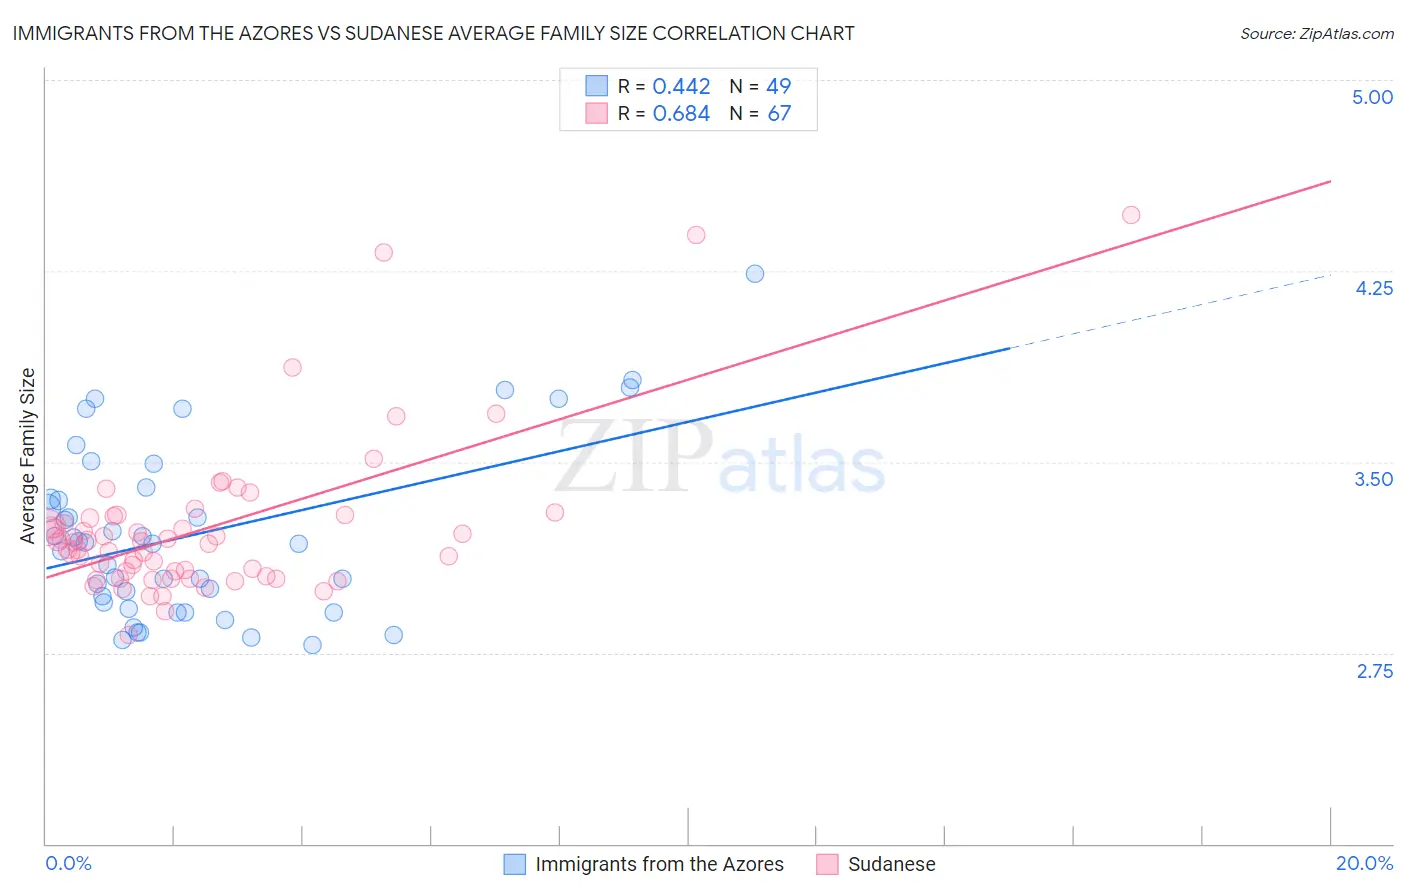
Immigrants from the Azores vs Sudanese Average Family Size Correlation Chart
The statistical analysis conducted on geographies consisting of 46,257,310 people shows a moderate positive correlation between the proportion of Immigrants from the Azores and average family size in the United States with a correlation coefficient (R) of 0.442 and weighted average of 3.21. Similarly, the statistical analysis conducted on geographies consisting of 110,078,191 people shows a significant positive correlation between the proportion of Sudanese and average family size in the United States with a correlation coefficient (R) of 0.684 and weighted average of 3.20, a difference of 0.27%.
Average Family Size Correlation Summary
| Measurement | Immigrants from the Azores | Sudanese |
| Minimum | 2.78 | 2.82 |
| Maximum | 4.24 | 4.47 |
| Range | 1.46 | 1.65 |
| Mean | 3.22 | 3.24 |
| Median | 3.18 | 3.18 |
| Interquartile 25% (IQ1) | 2.93 | 3.05 |
| Interquartile 75% (IQ3) | 3.38 | 3.28 |
| Interquartile Range (IQR) | 0.44 | 0.23 |
| Standard Deviation (Sample) | 0.34 | 0.31 |
| Standard Deviation (Population) | 0.34 | 0.31 |
Demographics Similar to Immigrants from the Azores and Sudanese by Average Family Size
In terms of average family size, the demographic groups most similar to Immigrants from the Azores are Hmong (3.21, a difference of 0.020%), Immigrants from Kenya (3.21, a difference of 0.070%), Immigrants from Morocco (3.21, a difference of 0.090%), Immigrants from India (3.21, a difference of 0.090%), and Immigrants from Nepal (3.21, a difference of 0.10%). Similarly, the demographic groups most similar to Sudanese are Chippewa (3.20, a difference of 0.0%), Filipino (3.20, a difference of 0.010%), Zimbabwean (3.20, a difference of 0.030%), Immigrants from Iran (3.20, a difference of 0.050%), and Creek (3.20, a difference of 0.050%).
| Demographics | Rating | Rank | Average Family Size |
| Immigrants | Israel | 29.3 /100 | #193 | Fair 3.22 |
| Immigrants | Sudan | 29.1 /100 | #194 | Fair 3.22 |
| Choctaw | 28.3 /100 | #195 | Fair 3.21 |
| Senegalese | 28.2 /100 | #196 | Fair 3.21 |
| Kenyans | 28.0 /100 | #197 | Fair 3.21 |
| Immigrants | Azores | 21.7 /100 | #198 | Fair 3.21 |
| Hmong | 20.7 /100 | #199 | Fair 3.21 |
| Immigrants | Kenya | 19.2 /100 | #200 | Poor 3.21 |
| Immigrants | Morocco | 18.5 /100 | #201 | Poor 3.21 |
| Immigrants | India | 18.5 /100 | #202 | Poor 3.21 |
| Immigrants | Nepal | 18.1 /100 | #203 | Poor 3.21 |
| Immigrants | Poland | 16.6 /100 | #204 | Poor 3.20 |
| Paraguayans | 16.3 /100 | #205 | Poor 3.20 |
| Immigrants | Cabo Verde | 16.0 /100 | #206 | Poor 3.20 |
| Filipinos | 13.6 /100 | #207 | Poor 3.20 |
| Chippewa | 13.3 /100 | #208 | Poor 3.20 |
| Sudanese | 13.3 /100 | #209 | Poor 3.20 |
| Zimbabweans | 12.6 /100 | #210 | Poor 3.20 |
| Immigrants | Iran | 12.1 /100 | #211 | Poor 3.20 |
| Creek | 12.1 /100 | #212 | Poor 3.20 |
| Mongolians | 11.5 /100 | #213 | Poor 3.20 |