Chickasaw vs Russian Average Family Size
COMPARE
Chickasaw
Russian
Average Family Size
Average Family Size Comparison
Chickasaw
Russians
3.19
AVERAGE FAMILY SIZE
6.0/ 100
METRIC RATING
226th/ 347
METRIC RANK
3.12
AVERAGE FAMILY SIZE
0.1/ 100
METRIC RATING
314th/ 347
METRIC RANK
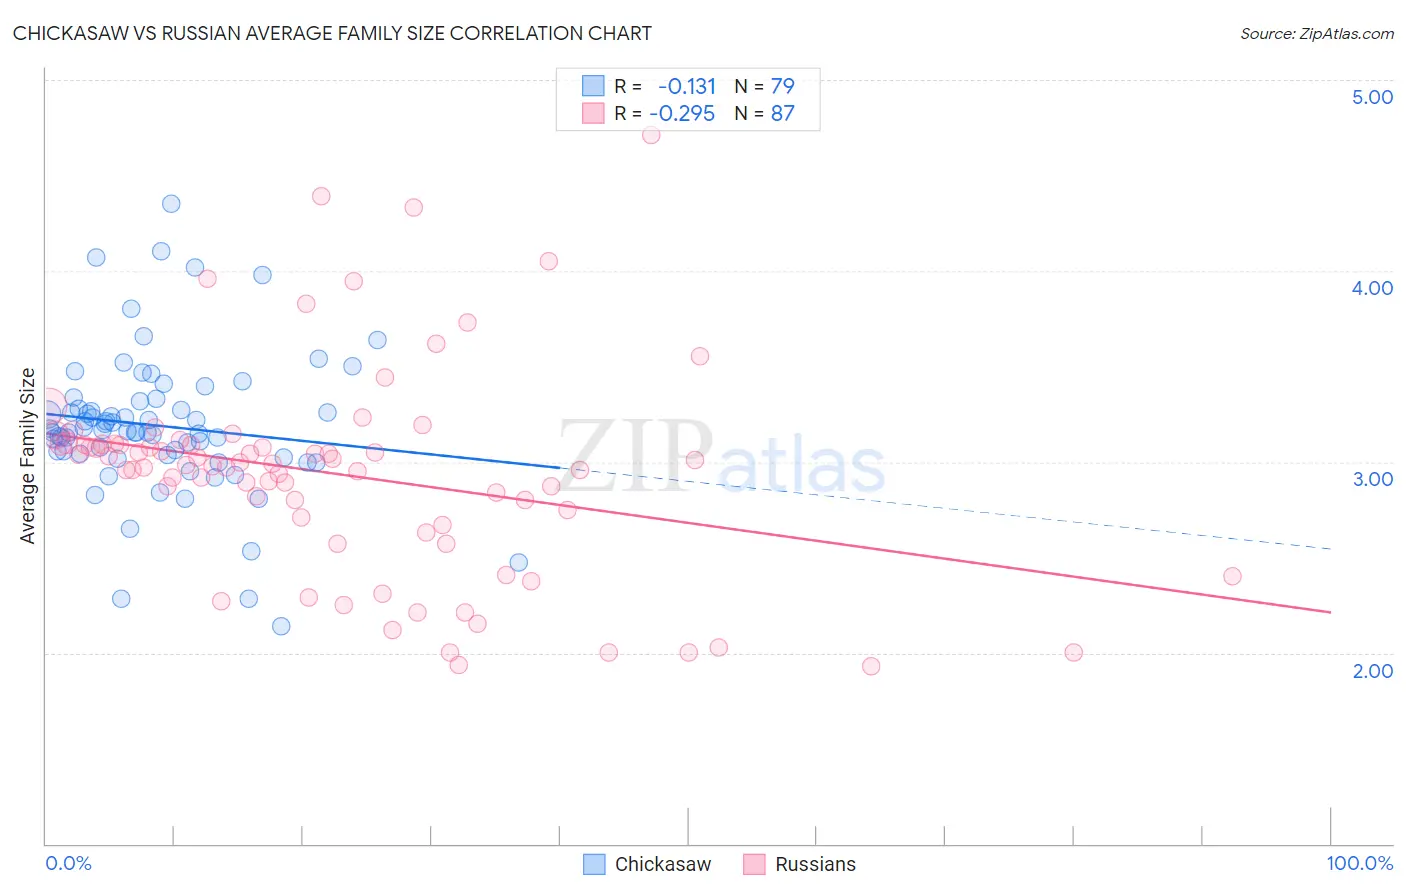
Chickasaw vs Russian Average Family Size Correlation Chart
The statistical analysis conducted on geographies consisting of 147,674,515 people shows a poor negative correlation between the proportion of Chickasaw and average family size in the United States with a correlation coefficient (R) of -0.131 and weighted average of 3.19. Similarly, the statistical analysis conducted on geographies consisting of 511,741,869 people shows a weak negative correlation between the proportion of Russians and average family size in the United States with a correlation coefficient (R) of -0.295 and weighted average of 3.12, a difference of 2.0%.
Average Family Size Correlation Summary
| Measurement | Chickasaw | Russian |
| Minimum | 2.14 | 1.93 |
| Maximum | 4.35 | 4.71 |
| Range | 2.21 | 2.78 |
| Mean | 3.19 | 2.93 |
| Median | 3.16 | 2.98 |
| Interquartile 25% (IQ1) | 3.04 | 2.67 |
| Interquartile 75% (IQ3) | 3.32 | 3.09 |
| Interquartile Range (IQR) | 0.28 | 0.42 |
| Standard Deviation (Sample) | 0.38 | 0.55 |
| Standard Deviation (Population) | 0.37 | 0.54 |
Similar Demographics by Average Family Size
Demographics Similar to Chickasaw by Average Family Size
In terms of average family size, the demographic groups most similar to Chickasaw are Portuguese (3.19, a difference of 0.0%), Cree (3.19, a difference of 0.020%), Nonimmigrants (3.19, a difference of 0.030%), Syrian (3.19, a difference of 0.040%), and Immigrants from Italy (3.19, a difference of 0.060%).
| Demographics | Rating | Rank | Average Family Size |
| Pennsylvania Germans | 9.3 /100 | #219 | Tragic 3.19 |
| Lebanese | 9.1 /100 | #220 | Tragic 3.19 |
| Immigrants | Ukraine | 7.2 /100 | #221 | Tragic 3.19 |
| Immigrants | Kuwait | 7.2 /100 | #222 | Tragic 3.19 |
| Immigrants | Zimbabwe | 7.1 /100 | #223 | Tragic 3.19 |
| Syrians | 6.5 /100 | #224 | Tragic 3.19 |
| Cree | 6.2 /100 | #225 | Tragic 3.19 |
| Chickasaw | 6.0 /100 | #226 | Tragic 3.19 |
| Portuguese | 6.0 /100 | #227 | Tragic 3.19 |
| Immigrants | Nonimmigrants | 5.7 /100 | #228 | Tragic 3.19 |
| Immigrants | Italy | 5.3 /100 | #229 | Tragic 3.19 |
| Icelanders | 5.2 /100 | #230 | Tragic 3.19 |
| Basques | 5.2 /100 | #231 | Tragic 3.19 |
| Cherokee | 4.7 /100 | #232 | Tragic 3.18 |
| Brazilians | 4.5 /100 | #233 | Tragic 3.18 |
Demographics Similar to Russians by Average Family Size
In terms of average family size, the demographic groups most similar to Russians are Immigrants from Scotland (3.12, a difference of 0.020%), Bulgarian (3.13, a difference of 0.040%), Immigrants from Australia (3.13, a difference of 0.050%), Immigrants from Northern Europe (3.13, a difference of 0.070%), and Czechoslovakian (3.13, a difference of 0.11%).
| Demographics | Rating | Rank | Average Family Size |
| Immigrants | Serbia | 0.1 /100 | #307 | Tragic 3.13 |
| Slavs | 0.1 /100 | #308 | Tragic 3.13 |
| Northern Europeans | 0.1 /100 | #309 | Tragic 3.13 |
| Czechoslovakians | 0.1 /100 | #310 | Tragic 3.13 |
| Immigrants | Northern Europe | 0.1 /100 | #311 | Tragic 3.13 |
| Immigrants | Australia | 0.1 /100 | #312 | Tragic 3.13 |
| Bulgarians | 0.1 /100 | #313 | Tragic 3.13 |
| Russians | 0.1 /100 | #314 | Tragic 3.12 |
| Immigrants | Scotland | 0.1 /100 | #315 | Tragic 3.12 |
| Serbians | 0.1 /100 | #316 | Tragic 3.12 |
| Italians | 0.1 /100 | #317 | Tragic 3.12 |
| Eastern Europeans | 0.1 /100 | #318 | Tragic 3.12 |
| Welsh | 0.1 /100 | #319 | Tragic 3.12 |
| Immigrants | North America | 0.0 /100 | #320 | Tragic 3.12 |
| Immigrants | Austria | 0.0 /100 | #321 | Tragic 3.12 |