Chickasaw vs Immigrants from Brazil Average Family Size
COMPARE
Chickasaw
Immigrants from Brazil
Average Family Size
Average Family Size Comparison
Chickasaw
Immigrants from Brazil
3.19
AVERAGE FAMILY SIZE
6.0/ 100
METRIC RATING
226th/ 347
METRIC RANK
3.18
AVERAGE FAMILY SIZE
2.7/ 100
METRIC RATING
245th/ 347
METRIC RANK
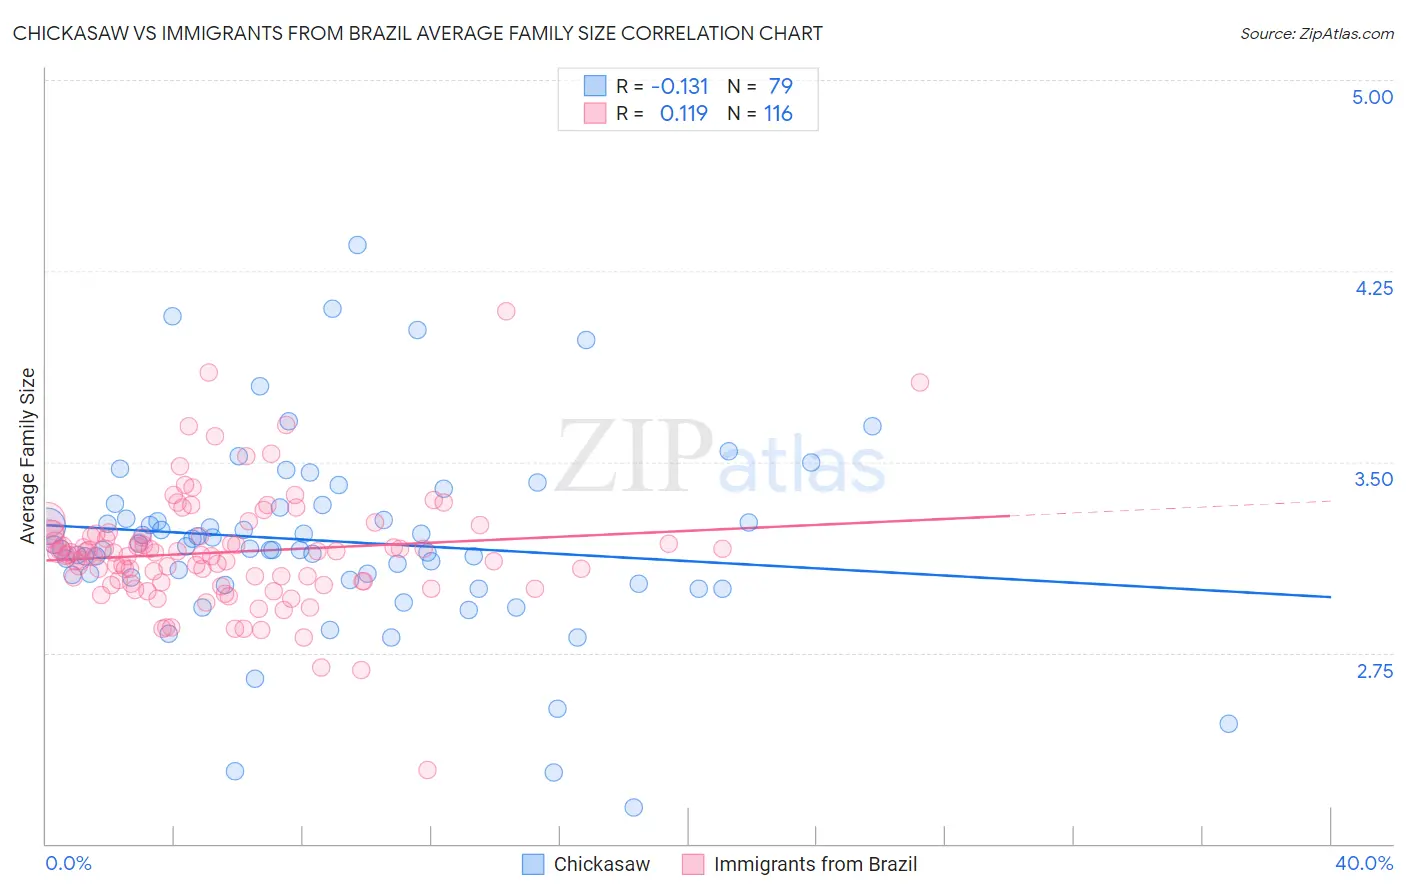
Chickasaw vs Immigrants from Brazil Average Family Size Correlation Chart
The statistical analysis conducted on geographies consisting of 147,674,515 people shows a poor negative correlation between the proportion of Chickasaw and average family size in the United States with a correlation coefficient (R) of -0.131 and weighted average of 3.19. Similarly, the statistical analysis conducted on geographies consisting of 342,856,280 people shows a poor positive correlation between the proportion of Immigrants from Brazil and average family size in the United States with a correlation coefficient (R) of 0.119 and weighted average of 3.18, a difference of 0.39%.
Average Family Size Correlation Summary
| Measurement | Chickasaw | Immigrants from Brazil |
| Minimum | 2.14 | 2.29 |
| Maximum | 4.35 | 4.09 |
| Range | 2.21 | 1.80 |
| Mean | 3.19 | 3.15 |
| Median | 3.16 | 3.14 |
| Interquartile 25% (IQ1) | 3.04 | 3.03 |
| Interquartile 75% (IQ3) | 3.32 | 3.21 |
| Interquartile Range (IQR) | 0.28 | 0.18 |
| Standard Deviation (Sample) | 0.38 | 0.23 |
| Standard Deviation (Population) | 0.37 | 0.23 |
Demographics Similar to Chickasaw and Immigrants from Brazil by Average Family Size
In terms of average family size, the demographic groups most similar to Chickasaw are Portuguese (3.19, a difference of 0.0%), Cree (3.19, a difference of 0.020%), Nonimmigrants (3.19, a difference of 0.030%), Immigrants from Italy (3.19, a difference of 0.060%), and Icelander (3.19, a difference of 0.080%). Similarly, the demographic groups most similar to Immigrants from Brazil are Immigrants from Southern Europe (3.18, a difference of 0.030%), Hungarian (3.18, a difference of 0.040%), Immigrants from Moldova (3.18, a difference of 0.040%), Immigrants from Japan (3.18, a difference of 0.060%), and Osage (3.18, a difference of 0.080%).
| Demographics | Rating | Rank | Average Family Size |
| Cree | 6.2 /100 | #225 | Tragic 3.19 |
| Chickasaw | 6.0 /100 | #226 | Tragic 3.19 |
| Portuguese | 6.0 /100 | #227 | Tragic 3.19 |
| Immigrants | Nonimmigrants | 5.7 /100 | #228 | Tragic 3.19 |
| Immigrants | Italy | 5.3 /100 | #229 | Tragic 3.19 |
| Icelanders | 5.2 /100 | #230 | Tragic 3.19 |
| Basques | 5.2 /100 | #231 | Tragic 3.19 |
| Cherokee | 4.7 /100 | #232 | Tragic 3.18 |
| Brazilians | 4.5 /100 | #233 | Tragic 3.18 |
| Iranians | 4.5 /100 | #234 | Tragic 3.18 |
| Immigrants | Turkey | 4.2 /100 | #235 | Tragic 3.18 |
| Immigrants | Portugal | 4.2 /100 | #236 | Tragic 3.18 |
| Immigrants | Romania | 3.7 /100 | #237 | Tragic 3.18 |
| Romanians | 3.7 /100 | #238 | Tragic 3.18 |
| Houma | 3.4 /100 | #239 | Tragic 3.18 |
| Osage | 3.2 /100 | #240 | Tragic 3.18 |
| Immigrants | Japan | 3.0 /100 | #241 | Tragic 3.18 |
| Hungarians | 3.0 /100 | #242 | Tragic 3.18 |
| Immigrants | Moldova | 2.9 /100 | #243 | Tragic 3.18 |
| Immigrants | Southern Europe | 2.9 /100 | #244 | Tragic 3.18 |
| Immigrants | Brazil | 2.7 /100 | #245 | Tragic 3.18 |