Chickasaw vs Albanian Average Family Size
COMPARE
Chickasaw
Albanian
Average Family Size
Average Family Size Comparison
Chickasaw
Albanians
3.19
AVERAGE FAMILY SIZE
6.0/ 100
METRIC RATING
226th/ 347
METRIC RANK
3.17
AVERAGE FAMILY SIZE
1.5/ 100
METRIC RATING
257th/ 347
METRIC RANK
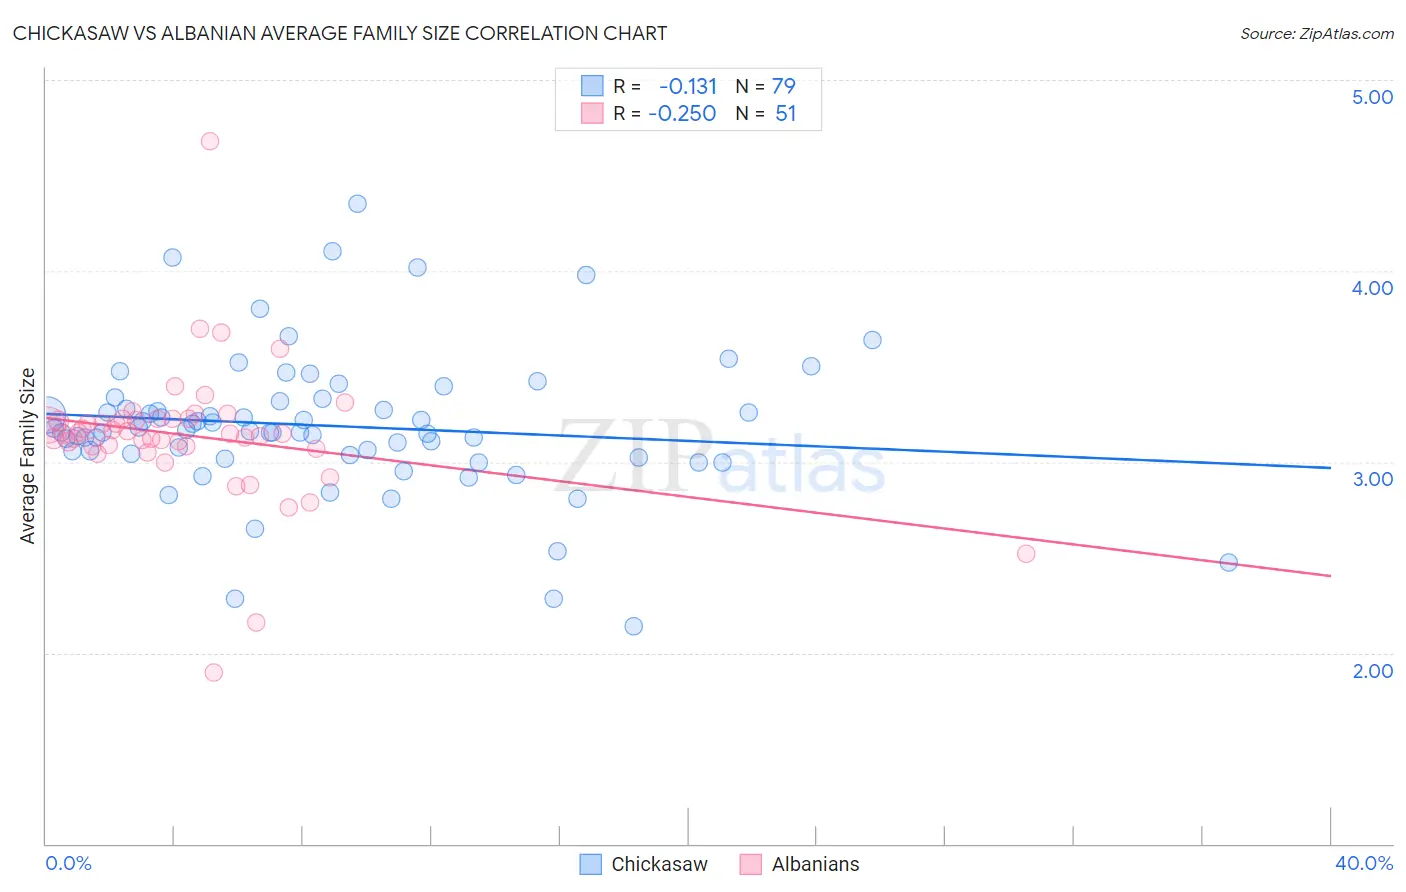
Chickasaw vs Albanian Average Family Size Correlation Chart
The statistical analysis conducted on geographies consisting of 147,674,515 people shows a poor negative correlation between the proportion of Chickasaw and average family size in the United States with a correlation coefficient (R) of -0.131 and weighted average of 3.19. Similarly, the statistical analysis conducted on geographies consisting of 193,186,402 people shows a weak negative correlation between the proportion of Albanians and average family size in the United States with a correlation coefficient (R) of -0.250 and weighted average of 3.17, a difference of 0.68%.
Average Family Size Correlation Summary
| Measurement | Chickasaw | Albanian |
| Minimum | 2.14 | 1.90 |
| Maximum | 4.35 | 4.68 |
| Range | 2.21 | 2.78 |
| Mean | 3.19 | 3.14 |
| Median | 3.16 | 3.15 |
| Interquartile 25% (IQ1) | 3.04 | 3.08 |
| Interquartile 75% (IQ3) | 3.32 | 3.22 |
| Interquartile Range (IQR) | 0.28 | 0.15 |
| Standard Deviation (Sample) | 0.38 | 0.37 |
| Standard Deviation (Population) | 0.37 | 0.37 |
Similar Demographics by Average Family Size
Demographics Similar to Chickasaw by Average Family Size
In terms of average family size, the demographic groups most similar to Chickasaw are Portuguese (3.19, a difference of 0.0%), Cree (3.19, a difference of 0.020%), Nonimmigrants (3.19, a difference of 0.030%), Syrian (3.19, a difference of 0.040%), and Immigrants from Italy (3.19, a difference of 0.060%).
| Demographics | Rating | Rank | Average Family Size |
| Pennsylvania Germans | 9.3 /100 | #219 | Tragic 3.19 |
| Lebanese | 9.1 /100 | #220 | Tragic 3.19 |
| Immigrants | Ukraine | 7.2 /100 | #221 | Tragic 3.19 |
| Immigrants | Kuwait | 7.2 /100 | #222 | Tragic 3.19 |
| Immigrants | Zimbabwe | 7.1 /100 | #223 | Tragic 3.19 |
| Syrians | 6.5 /100 | #224 | Tragic 3.19 |
| Cree | 6.2 /100 | #225 | Tragic 3.19 |
| Chickasaw | 6.0 /100 | #226 | Tragic 3.19 |
| Portuguese | 6.0 /100 | #227 | Tragic 3.19 |
| Immigrants | Nonimmigrants | 5.7 /100 | #228 | Tragic 3.19 |
| Immigrants | Italy | 5.3 /100 | #229 | Tragic 3.19 |
| Icelanders | 5.2 /100 | #230 | Tragic 3.19 |
| Basques | 5.2 /100 | #231 | Tragic 3.19 |
| Cherokee | 4.7 /100 | #232 | Tragic 3.18 |
| Brazilians | 4.5 /100 | #233 | Tragic 3.18 |
Demographics Similar to Albanians by Average Family Size
In terms of average family size, the demographic groups most similar to Albanians are Immigrants from Kazakhstan (3.17, a difference of 0.020%), Cape Verdean (3.17, a difference of 0.050%), Turkish (3.16, a difference of 0.050%), Potawatomi (3.16, a difference of 0.050%), and Immigrants from Hungary (3.17, a difference of 0.060%).
| Demographics | Rating | Rank | Average Family Size |
| Puget Sound Salish | 1.9 /100 | #250 | Tragic 3.17 |
| Immigrants | Spain | 1.8 /100 | #251 | Tragic 3.17 |
| Immigrants | Saudi Arabia | 1.7 /100 | #252 | Tragic 3.17 |
| South Africans | 1.7 /100 | #253 | Tragic 3.17 |
| Immigrants | Hungary | 1.7 /100 | #254 | Tragic 3.17 |
| Cape Verdeans | 1.6 /100 | #255 | Tragic 3.17 |
| Immigrants | Kazakhstan | 1.5 /100 | #256 | Tragic 3.17 |
| Albanians | 1.5 /100 | #257 | Tragic 3.17 |
| Turks | 1.3 /100 | #258 | Tragic 3.16 |
| Potawatomi | 1.3 /100 | #259 | Tragic 3.16 |
| Immigrants | Albania | 1.3 /100 | #260 | Tragic 3.16 |
| Immigrants | North Macedonia | 1.3 /100 | #261 | Tragic 3.16 |
| Immigrants | Russia | 1.3 /100 | #262 | Tragic 3.16 |
| Immigrants | Bulgaria | 1.0 /100 | #263 | Tragic 3.16 |
| Americans | 1.0 /100 | #264 | Tragic 3.16 |