Hopi vs Sudanese Average Family Size
COMPARE
Hopi
Sudanese
Average Family Size
Average Family Size Comparison
Hopi
Sudanese
3.60
AVERAGE FAMILY SIZE
100.0/ 100
METRIC RATING
9th/ 347
METRIC RANK
3.20
AVERAGE FAMILY SIZE
13.3/ 100
METRIC RATING
209th/ 347
METRIC RANK
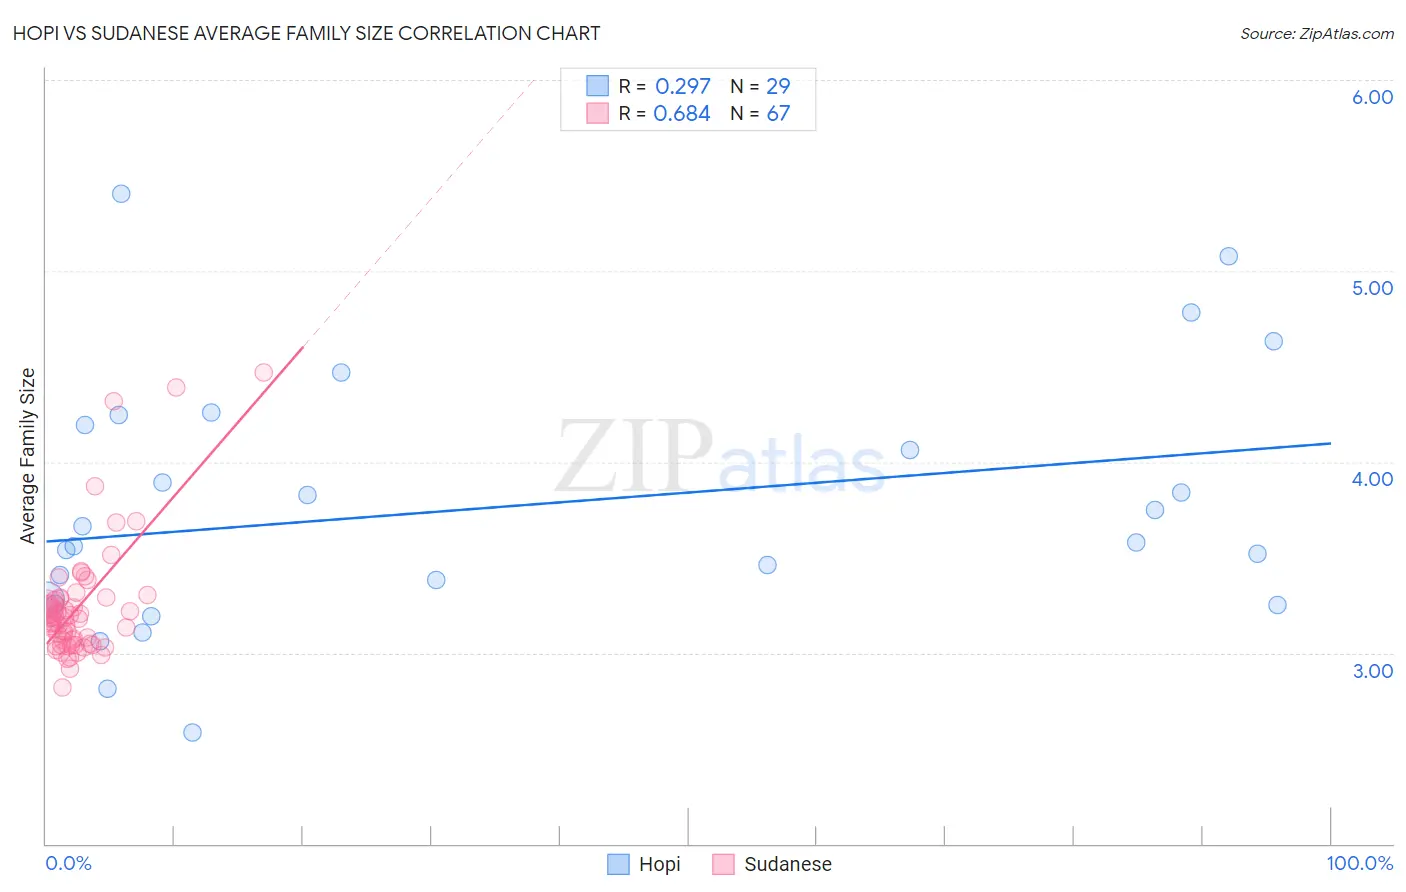
Hopi vs Sudanese Average Family Size Correlation Chart
The statistical analysis conducted on geographies consisting of 74,733,485 people shows a weak positive correlation between the proportion of Hopi and average family size in the United States with a correlation coefficient (R) of 0.297 and weighted average of 3.60. Similarly, the statistical analysis conducted on geographies consisting of 110,078,191 people shows a significant positive correlation between the proportion of Sudanese and average family size in the United States with a correlation coefficient (R) of 0.684 and weighted average of 3.20, a difference of 12.4%.
Average Family Size Correlation Summary
| Measurement | Hopi | Sudanese |
| Minimum | 2.58 | 2.82 |
| Maximum | 5.41 | 4.47 |
| Range | 2.83 | 1.65 |
| Mean | 3.76 | 3.24 |
| Median | 3.58 | 3.18 |
| Interquartile 25% (IQ1) | 3.27 | 3.05 |
| Interquartile 75% (IQ3) | 4.22 | 3.28 |
| Interquartile Range (IQR) | 0.95 | 0.23 |
| Standard Deviation (Sample) | 0.67 | 0.31 |
| Standard Deviation (Population) | 0.65 | 0.31 |
Similar Demographics by Average Family Size
Demographics Similar to Hopi by Average Family Size
In terms of average family size, the demographic groups most similar to Hopi are Immigrants from Yemen (3.60, a difference of 0.010%), Spanish American Indian (3.58, a difference of 0.35%), Inupiat (3.63, a difference of 0.87%), Arapaho (3.64, a difference of 1.1%), and Navajo (3.65, a difference of 1.4%).
| Demographics | Rating | Rank | Average Family Size |
| Crow | 100 /100 | #2 | Exceptional 3.82 |
| Pueblo | 100 /100 | #3 | Exceptional 3.79 |
| Pima | 100 /100 | #4 | Exceptional 3.75 |
| Navajo | 100.0 /100 | #5 | Exceptional 3.65 |
| Arapaho | 100.0 /100 | #6 | Exceptional 3.64 |
| Inupiat | 100.0 /100 | #7 | Exceptional 3.63 |
| Immigrants | Yemen | 100.0 /100 | #8 | Exceptional 3.60 |
| Hopi | 100.0 /100 | #9 | Exceptional 3.60 |
| Spanish American Indians | 100.0 /100 | #10 | Exceptional 3.58 |
| Tohono O'odham | 100.0 /100 | #11 | Exceptional 3.53 |
| Immigrants | Mexico | 100.0 /100 | #12 | Exceptional 3.52 |
| Sioux | 100.0 /100 | #13 | Exceptional 3.52 |
| Immigrants | Central America | 100.0 /100 | #14 | Exceptional 3.49 |
| Tongans | 100.0 /100 | #15 | Exceptional 3.49 |
| Ute | 100.0 /100 | #16 | Exceptional 3.49 |
Demographics Similar to Sudanese by Average Family Size
In terms of average family size, the demographic groups most similar to Sudanese are Chippewa (3.20, a difference of 0.0%), Filipino (3.20, a difference of 0.010%), Zimbabwean (3.20, a difference of 0.030%), Immigrants from Iran (3.20, a difference of 0.050%), and Creek (3.20, a difference of 0.050%).
| Demographics | Rating | Rank | Average Family Size |
| Immigrants | India | 18.5 /100 | #202 | Poor 3.21 |
| Immigrants | Nepal | 18.1 /100 | #203 | Poor 3.21 |
| Immigrants | Poland | 16.6 /100 | #204 | Poor 3.20 |
| Paraguayans | 16.3 /100 | #205 | Poor 3.20 |
| Immigrants | Cabo Verde | 16.0 /100 | #206 | Poor 3.20 |
| Filipinos | 13.6 /100 | #207 | Poor 3.20 |
| Chippewa | 13.3 /100 | #208 | Poor 3.20 |
| Sudanese | 13.3 /100 | #209 | Poor 3.20 |
| Zimbabweans | 12.6 /100 | #210 | Poor 3.20 |
| Immigrants | Iran | 12.1 /100 | #211 | Poor 3.20 |
| Creek | 12.1 /100 | #212 | Poor 3.20 |
| Mongolians | 11.5 /100 | #213 | Poor 3.20 |
| Somalis | 11.2 /100 | #214 | Poor 3.20 |
| Delaware | 11.1 /100 | #215 | Poor 3.20 |
| Bermudans | 11.0 /100 | #216 | Poor 3.20 |